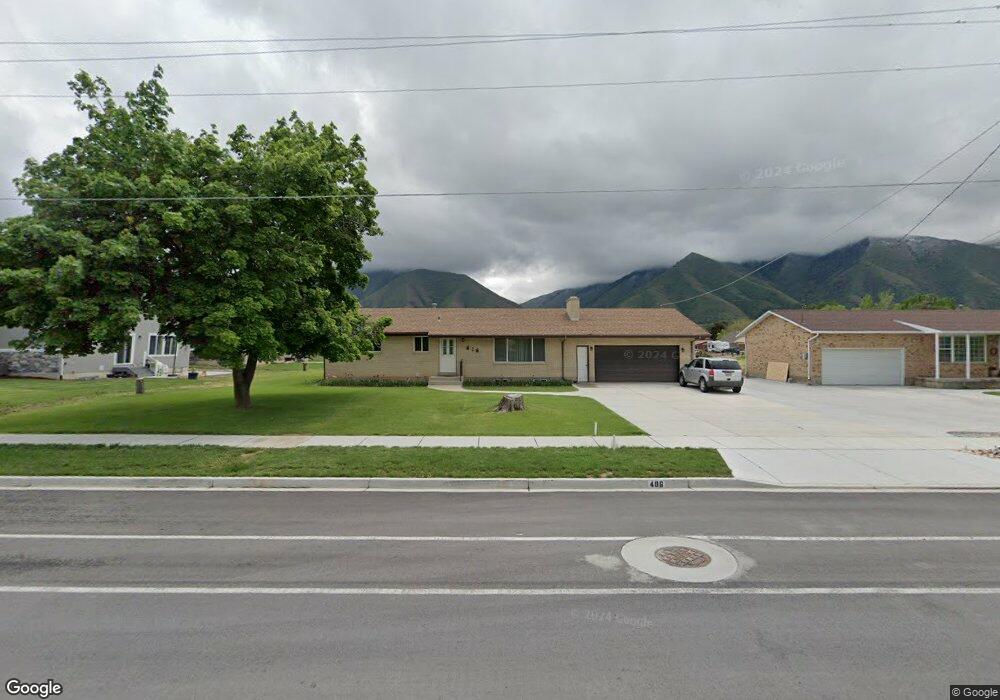
486 N Main St Mapleton, UT 84664
Estimated Value: $592,618 - $676,000
2
Beds
3
Baths
3,172
Sq Ft
$197/Sq Ft
Est. Value
About This Home
This home is located at 486 N Main St, Mapleton, UT 84664 and is currently estimated at $624,155, approximately $196 per square foot. 486 N Main St is a home located in Utah County with nearby schools including Hobble Creek School, Mapleton Junior High School, and Maple Mountain High School.
Ownership History
Date
Name
Owned For
Owner Type
Purchase Details
Closed on
Feb 20, 2020
Sold by
Clawson Dale Marion and Clawson Faye R
Bought by
Clawson Dale Marion and Clawson Ida Faye
Current Estimated Value
Purchase Details
Closed on
Jan 20, 2017
Sold by
Clawson Faye
Bought by
Clawson Dale Marion and Clawson Faye R
Home Financials for this Owner
Home Financials are based on the most recent Mortgage that was taken out on this home.
Original Mortgage
$240,000
Outstanding Balance
$197,838
Interest Rate
4.13%
Mortgage Type
Purchase Money Mortgage
Estimated Equity
$426,317
Purchase Details
Closed on
Jun 2, 2011
Sold by
Bills Richard Douglas and Bills Erma Lee
Bought by
Bills Richard Douglas and Bills Erma Lee
Purchase Details
Closed on
Apr 29, 2011
Sold by
Bills Stephen Richard and Bills Richard Douglas
Bought by
Bills Stephen Richard
Create a Home Valuation Report for This Property
The Home Valuation Report is an in-depth analysis detailing your home's value as well as a comparison with similar homes in the area
Home Values in the Area
Average Home Value in this Area
Purchase History
| Date | Buyer | Sale Price | Title Company |
|---|---|---|---|
| Clawson Dale Marion | -- | None Available | |
| Clawson Dale Marion | -- | Access Title Co | |
| Clawson Faye | -- | Access Title Co | |
| Bills Richard Douglas | -- | None Available | |
| Bills Stephen Richard | -- | None Available |
Source: Public Records
Mortgage History
| Date | Status | Borrower | Loan Amount |
|---|---|---|---|
| Open | Clawson Faye | $240,000 |
Source: Public Records
Tax History
| Year | Tax Paid | Tax Assessment Tax Assessment Total Assessment is a certain percentage of the fair market value that is determined by local assessors to be the total taxable value of land and additions on the property. | Land | Improvement |
|---|---|---|---|---|
| 2025 | $2,735 | $285,505 | -- | -- |
| 2024 | $2,735 | $267,960 | $0 | $0 |
| 2023 | $2,828 | $278,795 | $0 | $0 |
| 2022 | $3,296 | $321,255 | $0 | $0 |
| 2021 | $2,754 | $412,200 | $160,800 | $251,400 |
| 2020 | $2,720 | $393,700 | $142,300 | $251,400 |
| 2019 | $2,404 | $355,200 | $136,600 | $218,600 |
| 2018 | $2,230 | $313,700 | $115,000 | $198,700 |
| 2017 | $2,258 | $168,575 | $0 | $0 |
| 2016 | $1,708 | $126,771 | $0 | $0 |
| 2015 | $1,719 | $126,770 | $0 | $0 |
| 2014 | $1,750 | $126,772 | $0 | $0 |
Source: Public Records
Map
Nearby Homes
- 458 N Main St
- 456 N Main St
- 28 E 530 N Unit LOT 6
- 28 E 530 N
- 56 E 530 N
- 56 E 530 N Unit LOT 5
- 481 N 100 E
- 430 N Main St
- 420 N Main St
- 84 E 530 N Unit LOT 4
- 485 N Main St
- 23 E 530 N Unit LOT 10
- 511 N Main St
- 475 N Main St
- 47 E 530 N Unit LOT 9
- 47 E 530 N
- 79 E 400 N
- 443 N Main St
- 71 E 530 N Unit LOT 8
- 71 E 530 N
Your Personal Tour Guide
Ask me questions while you tour the home.