E
Seller's Agent in 2023
Eric Tamayo
Opendoor Brokerage, LLC
Estimated Value: $557,000 - $783,000
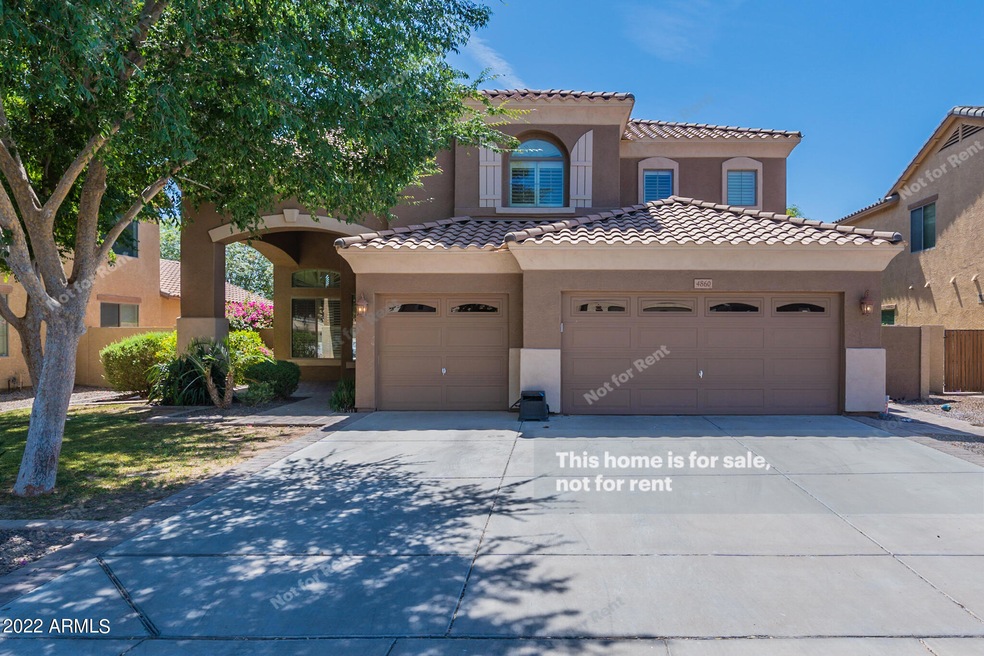
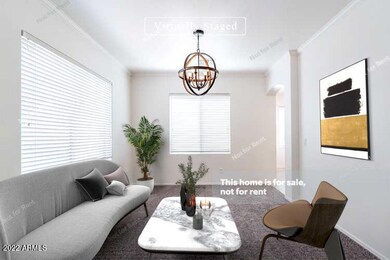
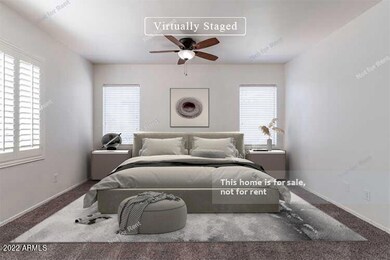
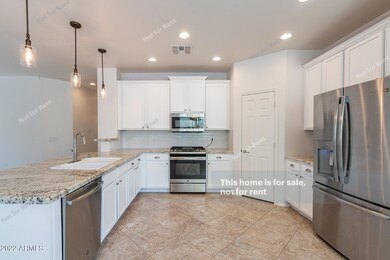
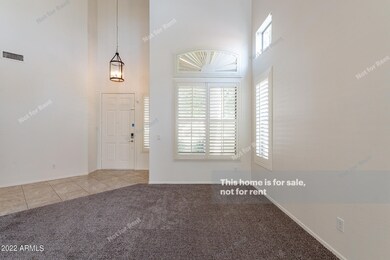
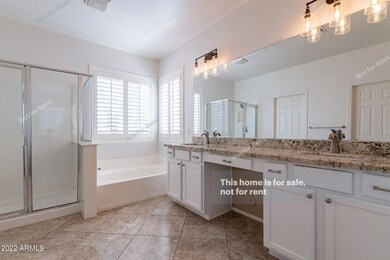
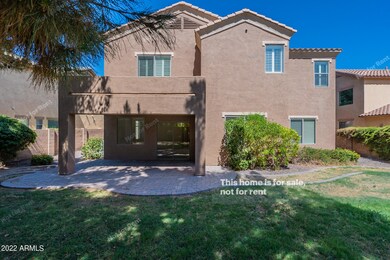
Come see this charming 5 bedroom, 3 bathroom home now on the market! Enjoy cooking in this stylish kitchen with updated counters, stainless appliances, white cabinets, tiled-backsplash and a breakfast bar, great for food preparation. Discover a bright interior with neutral tile floors and plush carpet in all the right places. Primary bathroom features a separate tub and shower, dual sinks and a spacious closet. Relax with your favourite drink in the backyard with nice grass. Hurry, this won't last long!
Last Agent to Sell the Property
Opendoor Brokerage, LLC Brokerage Email: homes@opendoor.com License #SA692411000 Listed on: 06/09/2022
Co-Listed By
Tiffany Hopkins
Opendoor Brokerage, LLC Brokerage Email: homes@opendoor.com License #BR662490000
We collect this data history from publicly available records. To have your information removed, we recommend requesting removal directly through your county’s website.
We collect this data history from publicly available records. To have your information removed, we recommend requesting removal directly through your county’s website.
| Date | Buyer | Sale Price | Title Company |
|---|---|---|---|
| -- | None Listed On Document | ||
| $603,000 | Os National | ||
| $748,200 | Os National | ||
| $404,000 | Jetclosing Inc | ||
| $365,000 | Nextitle | ||
| $365,000 | Nextitle | ||
| -- | None Available | ||
| $219,343 | None Available | ||
| $256,073 | -- |
We collect this data history from publicly available records. To have your information removed, we recommend requesting removal directly through your county’s website.
| Date | Status | Borrower | Loan Amount |
|---|---|---|---|
| Previous Owner | $572,850 | ||
| Previous Owner | $383,300 | ||
| Previous Owner | $170,000 | ||
| Previous Owner | $204,850 | ||
| Closed | $25,600 |
We collect this data history from publicly available records. To have your information removed, we recommend requesting removal directly through your county’s website.
| Date | Event | Price | List to Sale | Price per Sq Ft | Prior Sale |
|---|---|---|---|---|---|
| 02/13/2023 02/13/23 | Sold | $603,000 | -3.7% | $227 / Sq Ft | |
| 01/12/2023 01/12/23 | Pending | -- | -- | -- | |
| 11/03/2022 11/03/22 | Price Changed | $626,000 | -0.8% | $236 / Sq Ft | |
| 09/28/2022 09/28/22 | Price Changed | $631,000 | -3.7% | $238 / Sq Ft | |
| 09/08/2022 09/08/22 | Price Changed | $655,000 | -2.1% | $247 / Sq Ft | |
| 08/17/2022 08/17/22 | Price Changed | $669,000 | -2.0% | $252 / Sq Ft | |
| 08/04/2022 08/04/22 | Price Changed | $683,000 | -3.4% | $257 / Sq Ft | |
| 07/21/2022 07/21/22 | Price Changed | $707,000 | -3.3% | $266 / Sq Ft | |
| 07/07/2022 07/07/22 | Price Changed | $731,000 | -5.6% | $275 / Sq Ft | |
| 06/23/2022 06/23/22 | Price Changed | $774,000 | -0.1% | $292 / Sq Ft | |
| 06/09/2022 06/09/22 | For Sale | $775,000 | +3.6% | $292 / Sq Ft | |
| 05/10/2022 05/10/22 | Sold | $748,200 | 0.0% | $282 / Sq Ft | View Prior Sale |
| 05/02/2022 05/02/22 | Pending | -- | -- | -- | |
| 05/01/2022 05/01/22 | For Sale | $748,200 | +85.2% | $282 / Sq Ft | |
| 09/03/2019 09/03/19 | Sold | $404,000 | -2.4% | $138 / Sq Ft | View Prior Sale |
| 07/26/2019 07/26/19 | Pending | -- | -- | -- | |
| 07/12/2019 07/12/19 | Price Changed | $414,000 | -1.2% | $142 / Sq Ft | |
| 07/05/2019 07/05/19 | Price Changed | $419,000 | -2.6% | $143 / Sq Ft | |
| 06/08/2019 06/08/19 | For Sale | $430,000 | +17.8% | $147 / Sq Ft | |
| 04/10/2018 04/10/18 | Sold | $365,000 | +1.5% | $125 / Sq Ft | View Prior Sale |
| 04/04/2018 04/04/18 | Pending | -- | -- | -- | |
| 03/26/2018 03/26/18 | For Sale | $359,500 | 0.0% | $123 / Sq Ft | |
| 05/23/2014 05/23/14 | Rented | $1,500 | -18.9% | -- | |
| 04/30/2014 04/30/14 | For Rent | $1,850 | -- | -- | |
| 01/16/2014 01/16/14 | Under Contract | -- | -- | -- |
We collect this data history from publicly available records. To have your information removed, we recommend requesting removal directly through your county’s website.
| Year | Tax Paid | Tax Assessment Tax Assessment Total Assessment is a certain percentage of the fair market value that is determined by local assessors to be the total taxable value of land and additions on the property. | Land | Improvement |
|---|---|---|---|---|
| 2025 | $2,061 | $30,140 | -- | -- |
| 2024 | $2,286 | $26,063 | -- | -- |
| 2023 | $2,286 | $45,130 | $9,020 | $36,110 |
| 2022 | $2,653 | $33,110 | $6,620 | $26,490 |
| 2021 | $2,305 | $31,130 | $6,220 | $24,910 |
| 2020 | $2,293 | $29,420 | $5,880 | $23,540 |
| 2019 | $2,205 | $27,110 | $5,420 | $21,690 |
| 2018 | $2,132 | $25,130 | $5,020 | $20,110 |
| 2017 | $2,387 | $24,560 | $4,910 | $19,650 |
| 2016 | $2,287 | $23,770 | $4,750 | $19,020 |
| 2015 | $1,861 | $21,360 | $4,270 | $17,090 |
E
Seller's Agent in 2023
Eric Tamayo
Opendoor Brokerage, LLC
T
Seller Co-Listing Agent in 2023
Tiffany Hopkins
Opendoor Brokerage, LLC

Buyer's Agent in 2023
Tara Keator
Real Broker
(480) 703-3112
2 in this area
156 Total Sales
Seller's Agent in 2022
Mike Mazzucco
My Home Group
(480) 334-7062
2 in this area
203 Total Sales
Buyer's Agent in 2022
Andrea Groves
ADG Properties
(602) 291-1866
6 in this area
3,331 Total Sales
Seller's Agent in 2019
Jason LaFlesch
Results Realty
(602) 369-4663
3 in this area
227 Total Sales
Source: Arizona Regional Multiple Listing Service (ARMLS)
MLS Number: 6414430
APN: 304-72-499
Disclaimer: Certain information contained herein is derived from information provided by parties other than Homes.com. All information provided is deemed reliable, but is not guaranteed to be accurate and should be independently verified.
![]() All information should be verified by the recipient and none is guaranteed as accurate by ARMLS
All information should be verified by the recipient and none is guaranteed as accurate by ARMLS
Listing Information presented by local MLS brokerage: Ten-X, local REALTOR®- Arlene Richardson - (888)-952-6393
Ask me questions while you tour the home.