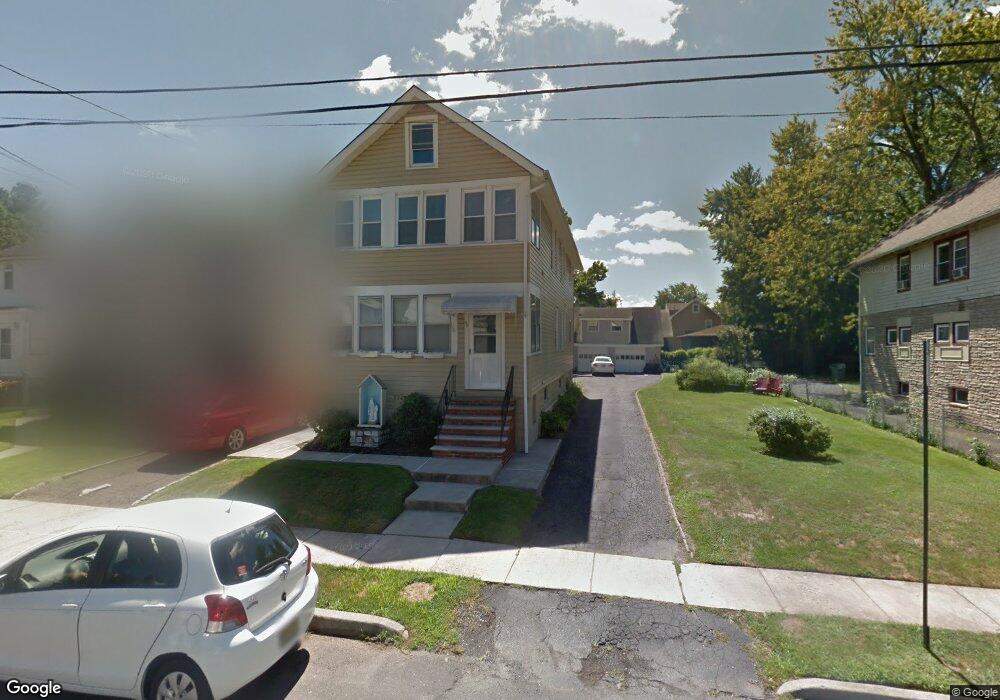
49 3rd Ave Garwood, NJ 07027
Estimated Value: $645,486 - $764,000
Studio
--
Bath
1,978
Sq Ft
$353/Sq Ft
Est. Value
About This Home
This home is located at 49 3rd Ave, Garwood, NJ 07027 and is currently estimated at $698,372, approximately $353 per square foot. 49 3rd Ave is a home located in Union County with nearby schools including Lincoln Franklin Elementary, St Michael School, and Christopher Academy Montessori.
Ownership History
Date
Name
Owned For
Owner Type
Purchase Details
Closed on
May 20, 2025
Sold by
Rinaldi James and Rinaldi Karen
Bought by
Rivero Luis and Rivero Marlene
Current Estimated Value
Purchase Details
Closed on
Feb 21, 2006
Sold by
Anthony R Romano Tr
Bought by
Rinaldi James and Rinaldi Karen
Home Financials for this Owner
Home Financials are based on the most recent Mortgage that was taken out on this home.
Original Mortgage
$340,000
Interest Rate
6.16%
Mortgage Type
New Conventional
Purchase Details
Closed on
Jun 26, 2002
Sold by
Romano Helen
Bought by
Romano Helen B
Create a Home Valuation Report for This Property
The Home Valuation Report is an in-depth analysis detailing your home's value as well as a comparison with similar homes in the area
Home Values in the Area
Average Home Value in this Area
Purchase History
| Date | Buyer | Sale Price | Title Company |
|---|---|---|---|
| Rivero Luis | $650,000 | Evident Title | |
| Rivero Luis | $650,000 | Evident Title | |
| Rinaldi James | $425,000 | -- | |
| Romano Helen B | -- | -- |
Source: Public Records
Mortgage History
| Date | Status | Borrower | Loan Amount |
|---|---|---|---|
| Previous Owner | Rinaldi James | $340,000 |
Source: Public Records
Tax History
| Year | Tax Paid | Tax Assessment Tax Assessment Total Assessment is a certain percentage of the fair market value that is determined by local assessors to be the total taxable value of land and additions on the property. | Land | Improvement |
|---|---|---|---|---|
| 2025 | $12,469 | $447,400 | $220,200 | $227,200 |
| 2024 | $12,098 | $447,400 | $220,200 | $227,200 |
| 2023 | $12,098 | $447,400 | $220,200 | $227,200 |
| 2022 | $11,776 | $447,400 | $220,200 | $227,200 |
| 2021 | $11,444 | $447,400 | $220,200 | $227,200 |
| 2020 | $11,261 | $447,400 | $220,200 | $227,200 |
| 2019 | $11,336 | $112,000 | $48,100 | $63,900 |
| 2018 | $11,094 | $112,000 | $48,100 | $63,900 |
| 2017 | $10,825 | $112,000 | $48,100 | $63,900 |
| 2016 | $10,546 | $112,000 | $48,100 | $63,900 |
| 2015 | $10,410 | $112,000 | $48,100 | $63,900 |
| 2014 | $10,037 | $112,000 | $48,100 | $63,900 |
Source: Public Records
Map
Nearby Homes
- 95 3rd Ave
- 24 Greaves Place
- 512 Gallows Hill Rd
- 312 3rd Ave
- 440 Orchard St
- 401 Brookside Place
- 603 Brookside Place
- 21 Spruce St
- 484 4th Ave Unit 9
- 438 3rd Ave
- 1008 Cranford Ave
- 214 Maple St
- 800 Cranford Ave
- 716 Center St
- 265 Hickory Ave
- 12 Dorchester Ave
- 529 Benson Place
- 443 Pine Ave
- 941 Harding St
- 564 Spruce Ave
Your Personal Tour Guide
Ask me questions while you tour the home.