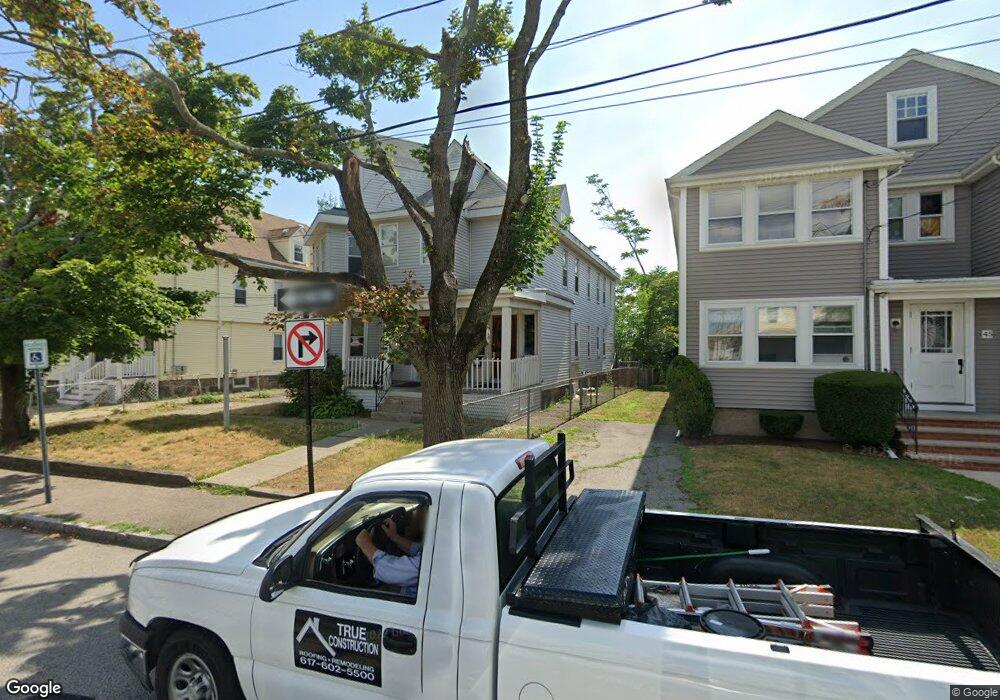
49-51 Holmes St 2d Quincy, MA 02171
Montclair NeighborhoodEstimated Value: $1,504,811
About This Home
This home is located at 49-51 Holmes St 2d, Quincy, MA 02171 and is currently priced at $1,504,811, approximately $15,048 per square foot. 49-51 Holmes St 2d is a home located in Norfolk County with nearby schools including Montclair Elementary School, Atlantic Middle School, and North Quincy High School.
Ownership History
We collect this data history from publicly available records. To have your information removed, we recommend requesting removal directly through your county’s website.
Purchase Details
Home Financials for this Owner
Home Financials are based on the most recent Mortgage that was taken out on this home.Purchase Details
Home Financials for this Owner
Home Financials are based on the most recent Mortgage that was taken out on this home.Purchase Details
Home Values in the Area
Average Home Value in this Area
Purchase History
We collect this data history from publicly available records. To have your information removed, we recommend requesting removal directly through your county’s website.
| Date | Buyer | Sale Price | Title Company |
|---|---|---|---|
| $1,300,000 | None Available | ||
| $1,080,000 | -- | ||
| $525,000 | -- |
Mortgage History
We collect this data history from publicly available records. To have your information removed, we recommend requesting removal directly through your county’s website.
| Date | Status | Borrower | Loan Amount |
|---|---|---|---|
| Open | $650,000 | ||
| Previous Owner | $655,000 | ||
| Previous Owner | $870,000 |
Tax History
We collect this data history from publicly available records. To have your information removed, we recommend requesting removal directly through your county’s website.
| Year | Tax Paid | Tax Assessment Tax Assessment Total Assessment is a certain percentage of the fair market value that is determined by local assessors to be the total taxable value of land and additions on the property. | Land | Improvement |
|---|---|---|---|---|
| 2025 | $14,208 | $1,232,300 | $373,100 | $859,200 |
| 2024 | $12,965 | $1,150,400 | $373,100 | $777,300 |
| 2023 | $10,796 | $970,000 | $355,300 | $614,700 |
| 2022 | $10,116 | $844,400 | $309,000 | $535,400 |
| 2021 | $10,023 | $825,600 | $294,200 | $531,400 |
| 2020 | $9,796 | $788,100 | $294,200 | $493,900 |
| 2019 | $9,759 | $777,600 | $275,000 | $502,600 |
| 2018 | $11,114 | $833,100 | $254,600 | $578,500 |
| 2017 | $10,147 | $716,100 | $242,500 | $473,600 |
| 2016 | $9,715 | $676,500 | $210,900 | $465,600 |
| 2015 | $9,096 | $623,000 | $191,700 | $431,300 |
| 2014 | $9,123 | $613,900 | $182,600 | $431,300 |
Map
- 120 Holmes St Unit 304
- 260 Newbury Ave
- 115 W Squantum St Unit 803
- 210 Newbury Ave Unit 2L
- 41 Buckingham Rd
- 24 Rawson Rd
- 10 Weston Ave Unit 112
- 72 French St
- 60 Harriet Ave
- 99 Newbury Ave
- 245 Newport Ave
- 94 Newbury Ave Unit 100
- 251 Newport Ave
- 53 Ellington Rd
- 54 Marshall St
- 89 Ardell St
- 80 Willet St
- 67 Colby Rd
- 267-269 Farrington St
- 40 Woodbine St
- 49 Holmes St Unit 3A
- 49 Holmes St Unit 2B
- 49 Holmes St Unit 3B
- 49 Holmes St Unit 3C
- 49 Holmes St Unit 3D
- 49 Holmes St Unit 1D
- 49 Holmes St
- 49 Holmes St Unit 51
- 45 Holmes St Unit 4
- 45 Holmes St Unit 3
- 45 Holmes St Unit 1
- 45 Holmes St
- 53 Holmes St
- 55 Holmes St Unit 55
- 53 Holmes St Unit 53
- 41 Holmes St
- 59 Holmes St
- 61 Holmes St
- 39 Holmes St Unit 39
- 39 Holmes St Unit 1
Ask me questions while you tour the home.