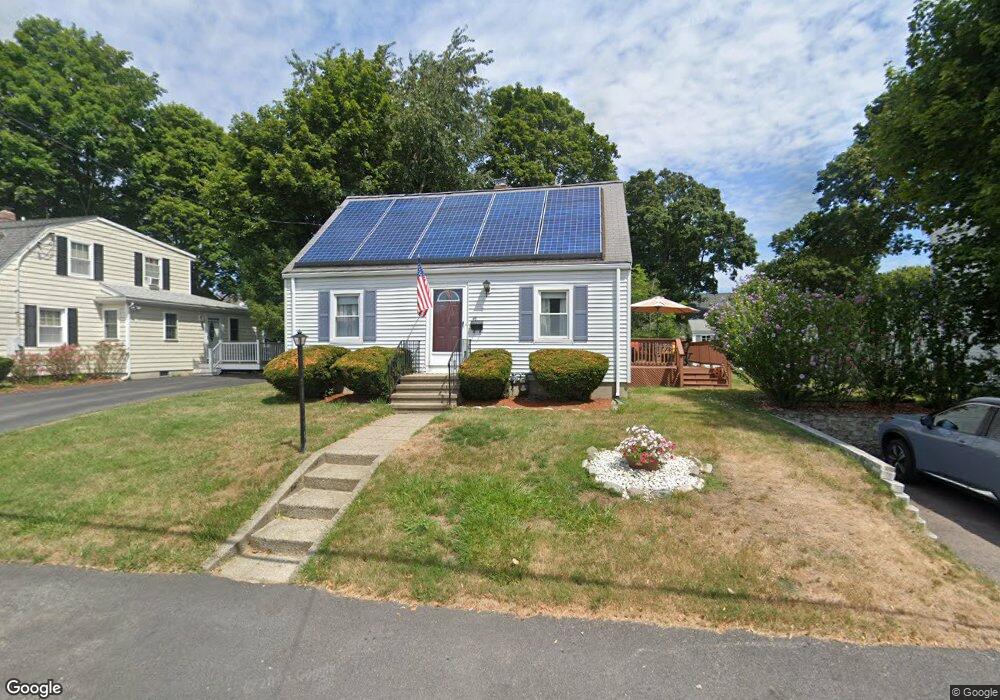
49 Apple Tree Ln Weymouth, MA 02188
Weymouth Landing NeighborhoodEstimated Value: $575,588 - $625,000
About This Home
This home is located at 49 Apple Tree Ln, Weymouth, MA 02188 and is currently estimated at $603,897, approximately $458 per square foot. 49 Apple Tree Ln is a home located in Norfolk County with nearby schools including Frederick C Murphy, Abigail Adams Middle School, and Weymouth Middle School Chapman.
Ownership History
We collect this data history from publicly available records. To have your information removed, we recommend requesting removal directly through your county’s website.
Purchase Details
Home Values in the Area
Average Home Value in this Area
Purchase History
We collect this data history from publicly available records. To have your information removed, we recommend requesting removal directly through your county’s website.
| Date | Buyer | Sale Price | Title Company |
|---|---|---|---|
| $107,000 | -- |
Mortgage History
We collect this data history from publicly available records. To have your information removed, we recommend requesting removal directly through your county’s website.
| Date | Status | Borrower | Loan Amount |
|---|---|---|---|
| Open | $232,000 | ||
| Closed | $248,000 | ||
| Closed | $260,000 | ||
| Closed | $22,500 | ||
| Closed | $225,000 | ||
| Closed | $180,000 | ||
| Closed | $168,000 |
Tax History
We collect this data history from publicly available records. To have your information removed, we recommend requesting removal directly through your county’s website.
| Year | Tax Paid | Tax Assessment Tax Assessment Total Assessment is a certain percentage of the fair market value that is determined by local assessors to be the total taxable value of land and additions on the property. | Land | Improvement |
|---|---|---|---|---|
| 2025 | $5,010 | $496,000 | $213,600 | $282,400 |
| 2024 | $4,852 | $472,400 | $203,400 | $269,000 |
| 2023 | $4,572 | $437,500 | $188,300 | $249,200 |
| 2022 | $4,463 | $389,400 | $174,400 | $215,000 |
| 2021 | $4,157 | $354,100 | $174,400 | $179,700 |
| 2020 | $3,950 | $331,400 | $174,400 | $157,000 |
| 2019 | $3,854 | $318,000 | $167,700 | $150,300 |
| 2018 | $3,738 | $299,000 | $159,700 | $139,300 |
| 2017 | $3,678 | $287,100 | $152,100 | $135,000 |
| 2016 | $3,592 | $280,600 | $146,300 | $134,300 |
| 2015 | $3,359 | $260,400 | $139,600 | $120,800 |
| 2014 | $3,127 | $235,100 | $129,900 | $105,200 |
Map
- 148 Summer St
- 66 Healy Rd
- 82 Lester Ln
- 64 Browning St
- 35 Cottage Ln
- 11 Stonewood Ln
- 19 Common St
- 12 Franklin St
- 61 Broad St
- 42 Kensington Rd
- 80 Kensington Rd
- 363 Liberty St
- 67 Washington St
- 179 Liberty St
- 81 Meredith Way
- 37 Lantern Ln
- 615 Front St
- 11 Brookside Rd Unit 3
- 11 Brookside Rd Unit 6
- 41 Lantern Ln
Ask me questions while you tour the home.