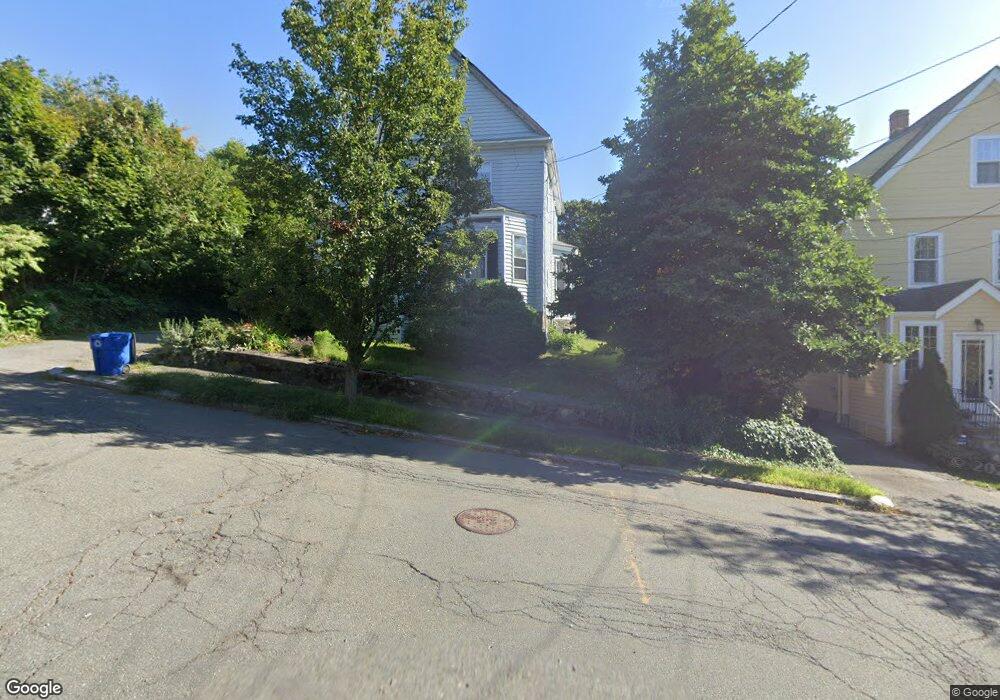
49 Appleton St Melrose, MA 02176
Melrose East Side NeighborhoodEstimated Value: $781,000 - $1,055,000
About This Home
This home is located at 49 Appleton St, Melrose, MA 02176 and is currently estimated at $876,390, approximately $482 per square foot. 49 Appleton St is a home located in Middlesex County with nearby schools including Hoover Elementary School, Lincoln Elementary School, and Winthrop Elementary School.
Ownership History
We collect this data history from publicly available records. To have your information removed, we recommend requesting removal directly through your county’s website.
Purchase Details
Purchase Details
Home Values in the Area
Average Home Value in this Area
Purchase History
We collect this data history from publicly available records. To have your information removed, we recommend requesting removal directly through your county’s website.
| Date | Buyer | Sale Price | Title Company |
|---|---|---|---|
| $163,000 | -- | ||
| $135,000 | -- |
Mortgage History
We collect this data history from publicly available records. To have your information removed, we recommend requesting removal directly through your county’s website.
| Date | Status | Borrower | Loan Amount |
|---|---|---|---|
| Open | $30,000 | ||
| Closed | $25,000 | ||
| Open | $160,000 |
Tax History
We collect this data history from publicly available records. To have your information removed, we recommend requesting removal directly through your county’s website.
| Year | Tax Paid | Tax Assessment Tax Assessment Total Assessment is a certain percentage of the fair market value that is determined by local assessors to be the total taxable value of land and additions on the property. | Land | Improvement |
|---|---|---|---|---|
| 2025 | $68 | $683,800 | $418,500 | $265,300 |
| 2024 | $6,481 | $652,700 | $393,100 | $259,600 |
| 2023 | $6,490 | $622,800 | $380,400 | $242,400 |
| 2022 | $6,492 | $614,200 | $380,400 | $233,800 |
| 2021 | $6,267 | $572,300 | $355,100 | $217,200 |
| 2020 | $5,904 | $534,300 | $317,000 | $217,300 |
| 2019 | $5,329 | $493,000 | $292,900 | $200,100 |
| 2018 | $5,284 | $466,400 | $266,300 | $200,100 |
| 2017 | $5,133 | $435,000 | $253,600 | $181,400 |
| 2016 | $5,004 | $405,800 | $247,300 | $158,500 |
| 2015 | $4,819 | $371,800 | $221,900 | $149,900 |
| 2014 | $4,602 | $346,500 | $196,600 | $149,900 |
Map
- 59 Beech Ave
- 7 Berkeley St
- 7 Park St
- 247 Lebanon St
- 28 Edgemere St
- 225 Grove St
- 71-73 Grove St
- 169 Grove St
- 59 Mystic Ave
- 73 Florence Ave
- 36 Grandview Ave
- 14 Rockwood St
- 2 Grove Place
- 51 Gooch St
- 31 Temple St
- 26 1st St
- 25 Cumner Ave
- 12 Mount Vernon St Unit 25
- 340 Main St Unit 301
- 340 Main St Unit 606
- 8 Fairmount St Unit other
- 8 Fairmount St
- 4 Fairmount St
- 12 Fairmount St
- 7 Irving St
- 3 Irving St
- 13 Irving St
- 16 Fairmount St
- 7 Fairmount St
- 15 Irving St
- 3 Fairmount St
- 11 Fairmount St
- 45 Appleton St
- 41 Appleton St
- 20 Fairmount St
- 15 Fairmount St
- 19 Irving St
- 37 Appleton St
- 19 Fairmount St
- 57 Appleton St
Ask me questions while you tour the home.