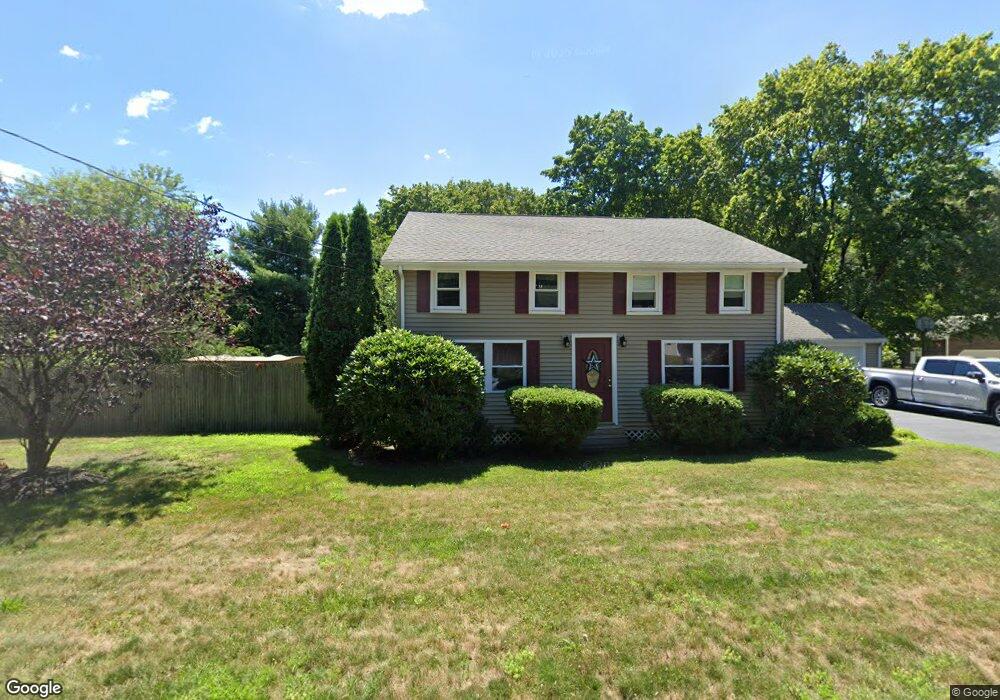
49 Back St Seekonk, MA 02771
Estimated Value: $532,000 - $551,000
4
Beds
2
Baths
1,709
Sq Ft
$317/Sq Ft
Est. Value
About This Home
This home is located at 49 Back St, Seekonk, MA 02771 and is currently estimated at $541,759, approximately $317 per square foot. 49 Back St is a home located in Bristol County with nearby schools including Seekonk High School, St Margaret School, and The Wolf School.
Ownership History
Date
Name
Owned For
Owner Type
Purchase Details
Closed on
Nov 30, 1995
Sold by
Penacho Alfred L and Penacho Lillian
Bought by
Mello Kenneth J
Current Estimated Value
Create a Home Valuation Report for This Property
The Home Valuation Report is an in-depth analysis detailing your home's value as well as a comparison with similar homes in the area
Home Values in the Area
Average Home Value in this Area
Purchase History
We collect this data history from publicly available records. To have your information removed, we recommend requesting removal directly through your county’s website.
| Date | Buyer | Sale Price | Title Company |
|---|---|---|---|
| Mello Kenneth J | $100,000 | -- |
Source: Public Records
Mortgage History
We collect this data history from publicly available records. To have your information removed, we recommend requesting removal directly through your county’s website.
| Date | Status | Borrower | Loan Amount |
|---|---|---|---|
| Open | Mello Kenneth J | $115,000 | |
| Closed | Mello Kenneth J | $125,000 | |
| Closed | Mello Kenneth J | $25,000 |
Source: Public Records
Tax History
| Year | Tax Paid | Tax Assessment Tax Assessment Total Assessment is a certain percentage of the fair market value that is determined by local assessors to be the total taxable value of land and additions on the property. | Land | Improvement |
|---|---|---|---|---|
| 2025 | $5,381 | $435,700 | $182,400 | $253,300 |
| 2024 | $5,193 | $420,500 | $182,400 | $238,100 |
| 2023 | $4,910 | $374,500 | $165,400 | $209,100 |
| 2022 | $4,529 | $339,500 | $161,000 | $178,500 |
| 2021 | $4,249 | $313,100 | $137,900 | $175,200 |
| 2020 | $4,113 | $312,300 | $137,800 | $174,500 |
| 2019 | $3,995 | $305,900 | $137,800 | $168,100 |
| 2018 | $3,918 | $293,500 | $132,800 | $160,700 |
| 2017 | $3,839 | $285,200 | $132,800 | $152,400 |
| 2016 | $3,992 | $297,700 | $132,800 | $164,900 |
| 2015 | $3,757 | $284,000 | $132,800 | $151,200 |
Source: Public Records
Map
Nearby Homes
Your Personal Tour Guide
Ask me questions while you tour the home.