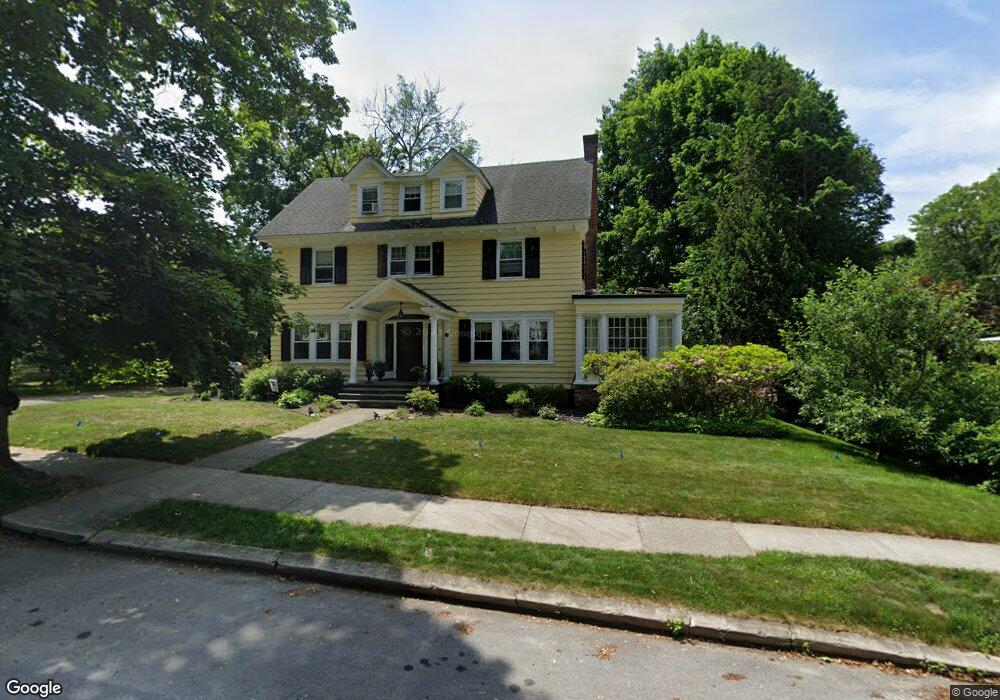
49 Berwick St Worcester, MA 01602
Newton Square NeighborhoodEstimated Value: $656,416 - $784,000
6
Beds
4
Baths
2,845
Sq Ft
$246/Sq Ft
Est. Value
About This Home
This home is located at 49 Berwick St, Worcester, MA 01602 and is currently estimated at $701,104, approximately $246 per square foot. 49 Berwick St is a home located in Worcester County with nearby schools including Chandler Magnet, Jacob Hiatt Magnet School, and Flagg Street School.
Ownership History
Date
Name
Owned For
Owner Type
Purchase Details
Closed on
May 29, 2009
Sold by
Ayres Elizabeth W
Bought by
Bowden Marc K and Bowden Lisa M
Current Estimated Value
Home Financials for this Owner
Home Financials are based on the most recent Mortgage that was taken out on this home.
Original Mortgage
$284,000
Outstanding Balance
$180,401
Interest Rate
4.87%
Mortgage Type
Purchase Money Mortgage
Estimated Equity
$520,703
Create a Home Valuation Report for This Property
The Home Valuation Report is an in-depth analysis detailing your home's value as well as a comparison with similar homes in the area
Home Values in the Area
Average Home Value in this Area
Purchase History
| Date | Buyer | Sale Price | Title Company |
|---|---|---|---|
| Bowden Marc K | $355,000 | -- |
Source: Public Records
Mortgage History
| Date | Status | Borrower | Loan Amount |
|---|---|---|---|
| Open | Bowden Marc K | $284,000 |
Source: Public Records
Tax History
| Year | Tax Paid | Tax Assessment Tax Assessment Total Assessment is a certain percentage of the fair market value that is determined by local assessors to be the total taxable value of land and additions on the property. | Land | Improvement |
|---|---|---|---|---|
| 2025 | $7,890 | $598,200 | $123,400 | $474,800 |
| 2024 | $7,681 | $558,600 | $123,400 | $435,200 |
| 2023 | $7,409 | $516,700 | $106,300 | $410,400 |
| 2022 | $6,895 | $453,300 | $85,100 | $368,200 |
| 2021 | $6,649 | $408,400 | $68,100 | $340,300 |
| 2020 | $6,610 | $388,800 | $67,900 | $320,900 |
| 2019 | $6,721 | $373,400 | $65,400 | $308,000 |
| 2018 | $6,645 | $351,400 | $65,400 | $286,000 |
| 2017 | $6,608 | $343,800 | $65,400 | $278,400 |
| 2016 | $6,822 | $331,000 | $53,300 | $277,700 |
| 2015 | $6,643 | $331,000 | $53,300 | $277,700 |
| 2014 | $6,460 | $330,600 | $53,300 | $277,300 |
Source: Public Records
Map
Nearby Homes
- 31 Lenox St
- 860 Pleasant St
- 4 Chamberlain Pkwy
- 6 Moore Ave
- 1 Ashmore Rd
- 42 Ellis Dr
- 28 Maplewood Rd
- 51 Brantwood Rd
- 10 Wrentham Rd Unit 308
- 12 Sherwood Rd
- 437 Salisbury St
- 5 Franconia St
- 89 Westview Rd
- 3 Franconia St
- 15 Chesterfield Rd
- 542 Chandler St
- 35 Chesterfield Rd
- 335 Salisbury St
- 108 Longfellow Rd
- 4 Hamill Rd
Your Personal Tour Guide
Ask me questions while you tour the home.