49 Cedar St Lynn, MA 01905
Pine Hill NeighborhoodEstimated Value: $463,000 - $547,000
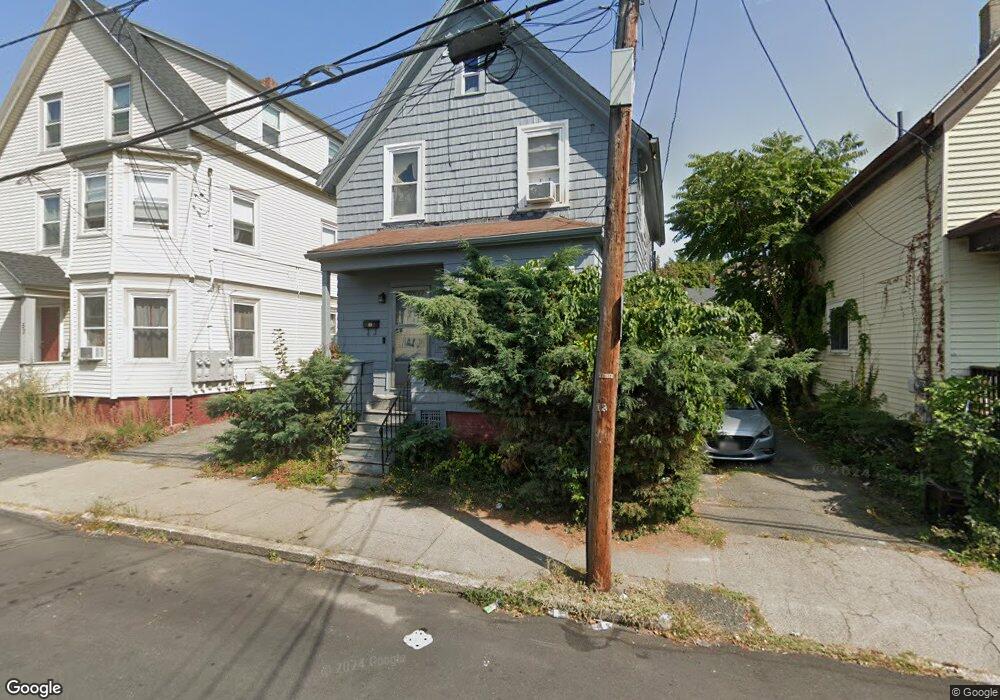
About This Home
This home is located at 49 Cedar St, Lynn, MA 01905 and is currently estimated at $513,810, approximately $445 per square foot. 49 Cedar St is a home located in Essex County with nearby schools including Tracy Elementary School, William R. Fallon School, and Fecteau-Leary Junior/Senior High School.
Ownership History
We collect this data history from publicly available records. To have your information removed, we recommend requesting removal directly through your county’s website.
Purchase Details
Purchase Details
Home Financials for this Owner
Home Financials are based on the most recent Mortgage that was taken out on this home.Home Values in the Area
Average Home Value in this Area
Purchase History
We collect this data history from publicly available records. To have your information removed, we recommend requesting removal directly through your county’s website.
| Date | Buyer | Sale Price | Title Company |
|---|---|---|---|
| -- | -- | ||
| -- | -- | ||
| $95,000 | -- | ||
| $95,000 | -- |
Mortgage History
We collect this data history from publicly available records. To have your information removed, we recommend requesting removal directly through your county’s website.
| Date | Status | Borrower | Loan Amount |
|---|---|---|---|
| Open | $23,000 | ||
| Closed | $25,000 | ||
| Previous Owner | $75,000 |
Tax History
We collect this data history from publicly available records. To have your information removed, we recommend requesting removal directly through your county’s website.
| Year | Tax Paid | Tax Assessment Tax Assessment Total Assessment is a certain percentage of the fair market value that is determined by local assessors to be the total taxable value of land and additions on the property. | Land | Improvement |
|---|---|---|---|---|
| 2025 | $4,728 | $456,400 | $176,800 | $279,600 |
| 2024 | $4,527 | $429,900 | $166,200 | $263,700 |
| 2023 | $4,360 | $391,000 | $161,000 | $230,000 |
| 2022 | $4,395 | $353,600 | $149,200 | $204,400 |
| 2021 | $4,344 | $333,400 | $143,200 | $190,200 |
| 2020 | $4,031 | $300,800 | $126,200 | $174,600 |
| 2019 | $3,822 | $267,300 | $103,300 | $164,000 |
| 2018 | $3,362 | $221,900 | $85,900 | $136,000 |
| 2017 | $3,193 | $204,700 | $72,800 | $131,900 |
| 2016 | $3,060 | $189,100 | $64,900 | $124,200 |
| 2015 | $2,817 | $168,200 | $60,500 | $107,700 |
Map
- 13 Moulton St
- 23 N Federal St
- 26 Kirtland St
- 35-37 Park St
- 138 Franklin St
- 55 Harwood St
- 139 Franklin St
- 74 Linwood St
- 502 Western Ave
- 108 Franklin St
- 82 Linwood St
- 42 Baker St
- 121 N Common St
- 29 Woodlawn St
- 15 Flint St
- 13 Curtis St
- 449 Western Ave
- 19 Huss Ct
- 51 Laighton St Unit 7
- 49 Laighton St Unit 4
- 53 Cedar St
- 53 Cedar St Unit 1
- 45 Cedar St
- 42 Grove St
- 40 Grove St
- 46 Grove St
- 46 Grove St Unit 3
- 46 Grove St Unit 1
- 43 Cedar St
- 38 Grove St
- 38 Grove St Unit 1
- 38 Grove St Unit 2
- 55 Cedar St Unit 1
- 55 Cedar St Unit 57
- 55 Cedar St Unit 3
- 50 Grove St
- 36 Grove St
- 39 Grove St Unit 2
- 59 Cedar St
- 48 Cedar St
Ask me questions while you tour the home.