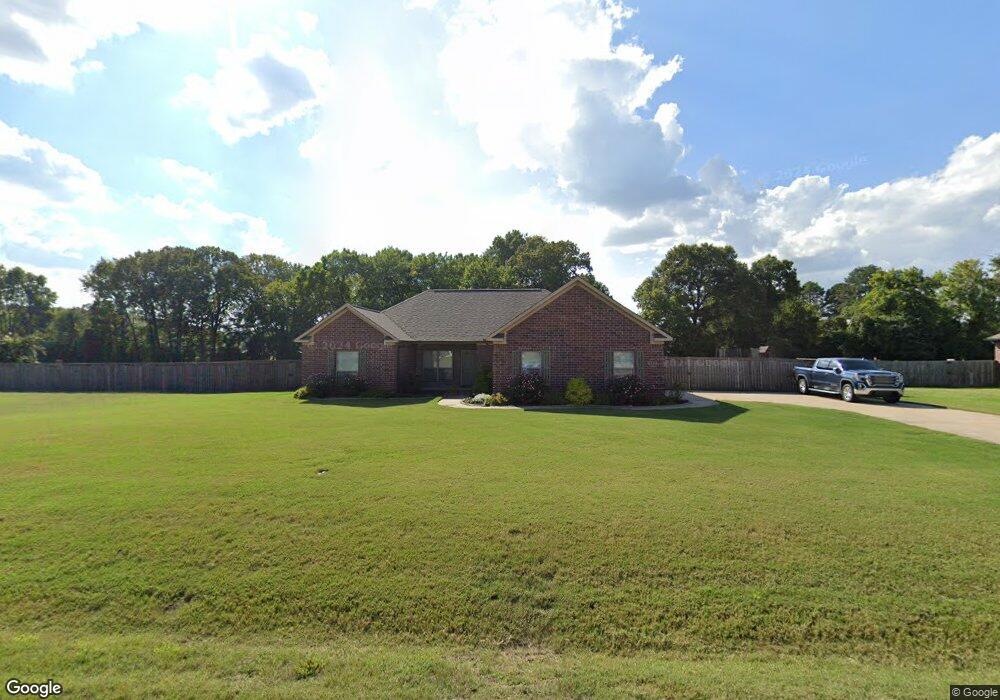
49 Colt Loop Greenbrier, AR 72058
Estimated Value: $329,117 - $376,000
Studio
--
Bath
1,919
Sq Ft
$187/Sq Ft
Est. Value
About This Home
This home is located at 49 Colt Loop, Greenbrier, AR 72058 and is currently estimated at $358,529, approximately $186 per square foot. 49 Colt Loop is a home with nearby schools including Greenbrier Wooster Elementary School, Greenbrier Junior High School, and Greenbrier High School.
Ownership History
Date
Name
Owned For
Owner Type
Purchase Details
Closed on
Mar 20, 2020
Sold by
Johnson Paul Brian and Johnson Holly M
Bought by
Grantham Lonnie
Current Estimated Value
Home Financials for this Owner
Home Financials are based on the most recent Mortgage that was taken out on this home.
Original Mortgage
$232,222
Outstanding Balance
$205,274
Interest Rate
3.4%
Mortgage Type
New Conventional
Estimated Equity
$153,255
Purchase Details
Closed on
Aug 29, 2013
Sold by
Ellison Contractors Inc
Bought by
Johnson Paul Brian and Johnson Holly M
Home Financials for this Owner
Home Financials are based on the most recent Mortgage that was taken out on this home.
Original Mortgage
$181,390
Interest Rate
4.42%
Mortgage Type
New Conventional
Purchase Details
Closed on
May 29, 2013
Sold by
M&H Land Llc
Bought by
Ellison Contractors Inc
Home Financials for this Owner
Home Financials are based on the most recent Mortgage that was taken out on this home.
Original Mortgage
$151,920
Interest Rate
3.43%
Mortgage Type
Credit Line Revolving
Create a Home Valuation Report for This Property
The Home Valuation Report is an in-depth analysis detailing your home's value as well as a comparison with similar homes in the area
Home Values in the Area
Average Home Value in this Area
Purchase History
| Date | Buyer | Sale Price | Title Company |
|---|---|---|---|
| Grantham Lonnie | $229,900 | Faulkner County Title Co | |
| Johnson Paul Brian | $187,000 | None Available | |
| Ellison Contractors Inc | $49,500 | None Available |
Source: Public Records
Mortgage History
| Date | Status | Borrower | Loan Amount |
|---|---|---|---|
| Open | Grantham Lonnie | $232,222 | |
| Previous Owner | Johnson Paul Brian | $181,390 | |
| Previous Owner | Ellison Contractors Inc | $151,920 |
Source: Public Records
Tax History
| Year | Tax Paid | Tax Assessment Tax Assessment Total Assessment is a certain percentage of the fair market value that is determined by local assessors to be the total taxable value of land and additions on the property. | Land | Improvement |
|---|---|---|---|---|
| 2025 | $2,556 | $62,440 | $7,000 | $55,440 |
| 2024 | $2,460 | $62,440 | $7,000 | $55,440 |
| 2023 | $2,342 | $47,610 | $7,000 | $40,610 |
| 2022 | $2,007 | $47,610 | $7,000 | $40,610 |
| 2021 | $2,007 | $47,610 | $7,000 | $40,610 |
| 2020 | $1,561 | $38,530 | $6,800 | $31,730 |
| 2019 | $1,573 | $38,790 | $6,800 | $31,990 |
| 2018 | $1,598 | $38,790 | $6,800 | $31,990 |
| 2017 | $1,598 | $38,790 | $6,800 | $31,990 |
| 2016 | $1,598 | $38,790 | $6,800 | $31,990 |
| 2015 | $1,717 | $37,080 | $6,800 | $30,280 |
| 2014 | $1,407 | $0 | $0 | $0 |
Source: Public Records
Map
Nearby Homes
- 54 Colt Loop
- 68 Colt Loop
- 7 Neva Ridge Rd
- 58 Elliott Rd
- Lot 9 J Hawks Dr
- 13 Pear Cir
- 0 Hwy 65 Unit 18011955
- 653 U S 65
- 15 S Springhill Ln
- 5 E Cadron Ridge Rd
- 00 Sandlewood Rd
- 5 Kirby Dr
- 10 W Martin Ln
- 000 Hwy 65 Springhill
- 000 Brannon Rd
- 13 Loyal Ln
- 58 Phillips Place Dr
- 9 Tannon Cove
- 16 Cherub Ct
- 11 E Chateau Estates
Your Personal Tour Guide
Ask me questions while you tour the home.