49 Elliott Dr Lowell, MA 01852
Belvidere NeighborhoodEstimated Value: $576,000 - $638,000
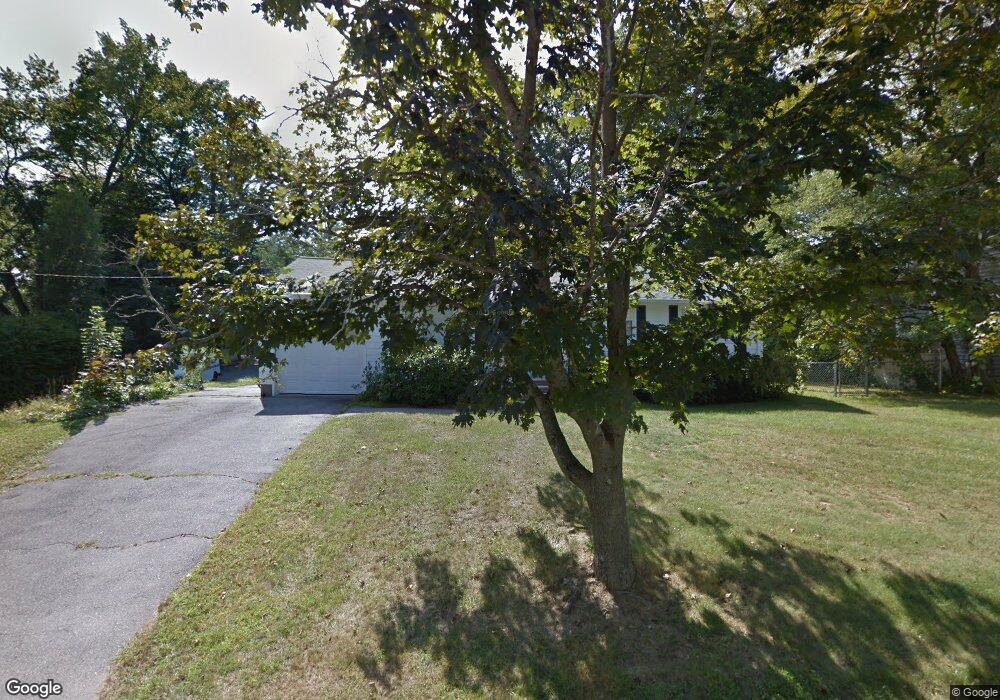
About This Home
This home is located at 49 Elliott Dr, Lowell, MA 01852 and is currently estimated at $606,180, approximately $452 per square foot. 49 Elliott Dr is a home located in Middlesex County with nearby schools including Moody Elementary School, Abraham Lincoln Elementary School, and Greenhalge Elementary School.
Ownership History
We collect this data history from publicly available records. To have your information removed, we recommend requesting removal directly through your county’s website.
Purchase Details
Home Values in the Area
Average Home Value in this Area
Purchase History
We collect this data history from publicly available records. To have your information removed, we recommend requesting removal directly through your county’s website.
| Date | Buyer | Sale Price | Title Company |
|---|---|---|---|
| -- | -- |
Tax History
We collect this data history from publicly available records. To have your information removed, we recommend requesting removal directly through your county’s website.
| Year | Tax Paid | Tax Assessment Tax Assessment Total Assessment is a certain percentage of the fair market value that is determined by local assessors to be the total taxable value of land and additions on the property. | Land | Improvement |
|---|---|---|---|---|
| 2025 | $6,159 | $536,500 | $244,600 | $291,900 |
| 2024 | $5,961 | $500,500 | $228,600 | $271,900 |
| 2023 | $5,651 | $455,000 | $198,800 | $256,200 |
| 2022 | $5,138 | $404,900 | $180,700 | $224,200 |
| 2021 | $4,960 | $368,500 | $157,100 | $211,400 |
| 2020 | $4,597 | $344,100 | $157,100 | $187,000 |
| 2019 | $4,837 | $344,500 | $156,300 | $188,200 |
| 2018 | $4,622 | $321,200 | $148,800 | $172,400 |
| 2017 | $4,494 | $301,200 | $138,100 | $163,100 |
| 2016 | $4,198 | $276,900 | $127,100 | $149,800 |
| 2015 | $4,224 | $272,900 | $127,100 | $145,800 |
| 2013 | $3,939 | $262,400 | $140,300 | $122,100 |
Map
- 18 Nob Way
- 294 Wentworth Ave
- 239 Fairmount St
- 192 Wentworth Ave
- 316 Rogers St
- 31 Sycamore St
- 62 Parkview Ave
- 308 Rogers St
- 133 Fairmount St
- 105 Starr Ave
- 125 Hoyt Ave
- 32 Belmont Ave
- 2 Douglas Terrace
- 50 Wentworth Ave
- 471 Butman Rd
- 21 Guild St
- 487 Wentworth Ave
- 305 Andover St
- 62 Huntington St
- 116 Fort Hill Ave
Ask me questions while you tour the home.