49 Mirasol Dr Bourne, MA 2532
Estimated Value: $700,000 - $880,000
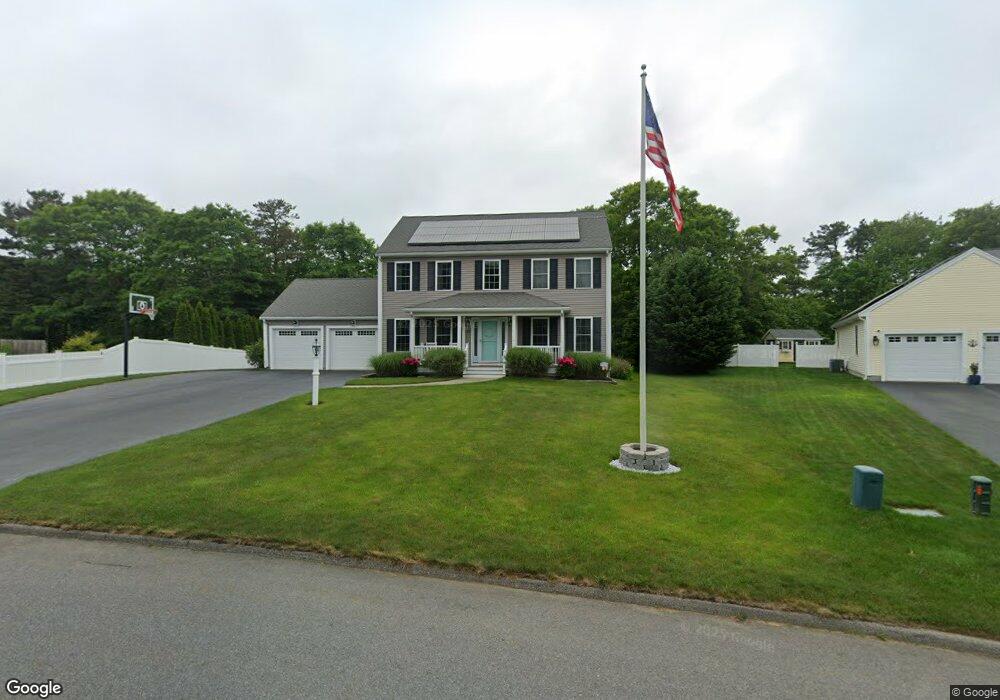
About This Home
This home is located at 49 Mirasol Dr, Bourne, MA 2532 and is currently estimated at $786,975, approximately $361 per square foot. 49 Mirasol Dr is a home located in Barnstable County with nearby schools including Bourne High School and St Margaret Regional School.
Ownership History
We collect this data history from publicly available records. To have your information removed, we recommend requesting removal directly through your county’s website.
Purchase Details
Home Financials for this Owner
Home Financials are based on the most recent Mortgage that was taken out on this home.Purchase Details
Home Financials for this Owner
Home Financials are based on the most recent Mortgage that was taken out on this home.Purchase Details
Home Financials for this Owner
Home Financials are based on the most recent Mortgage that was taken out on this home.Purchase History
We collect this data history from publicly available records. To have your information removed, we recommend requesting removal directly through your county’s website.
| Date | Buyer | Sale Price | Title Company |
|---|---|---|---|
| -- | -- | ||
| -- | -- | ||
| $450,000 | -- | ||
| $450,000 | -- | ||
| $373,050 | -- | ||
| $15,458 | -- | ||
| $15,458 | -- | ||
| $373,050 | -- | ||
| $15,458 | -- |
Mortgage History
We collect this data history from publicly available records. To have your information removed, we recommend requesting removal directly through your county’s website.
| Date | Status | Borrower | Loan Amount |
|---|---|---|---|
| Open | $440,000 | ||
| Closed | $440,000 | ||
| Previous Owner | $450,000 | ||
| Previous Owner | $381,070 | ||
| Previous Owner | $0 |
Tax History
We collect this data history from publicly available records. To have your information removed, we recommend requesting removal directly through your county’s website.
| Year | Tax Paid | Tax Assessment Tax Assessment Total Assessment is a certain percentage of the fair market value that is determined by local assessors to be the total taxable value of land and additions on the property. | Land | Improvement |
|---|---|---|---|---|
| 2025 | $5,779 | $739,900 | $213,600 | $526,300 |
| 2024 | $5,693 | $709,900 | $203,400 | $506,500 |
| 2023 | $5,721 | $649,400 | $196,400 | $453,000 |
| 2022 | $5,419 | $537,100 | $173,800 | $363,300 |
| 2021 | $5,302 | $492,300 | $158,200 | $334,100 |
| 2020 | $5,155 | $480,000 | $156,700 | $323,300 |
| 2019 | $4,101 | $464,900 | $156,700 | $308,200 |
| 2018 | $3,643 | $404,400 | $149,200 | $255,200 |
| 2017 | $3,257 | $394,400 | $141,600 | $252,800 |
| 2016 | $3,769 | $371,000 | $129,300 | $241,700 |
| 2015 | $3,675 | $364,900 | $123,200 | $241,700 |
Map
- 20 Settlers Way
- 391 Scenic Hwy
- 33 Head of The Bay Rd
- 9 Fabyan Way
- 6 Honora Ln
- 5 Honora Ln Unit 5
- 5 Honora Ln
- 3 Honora Ln Unit 3
- 29 Weather Deck Rd
- 51 Ships View Terrace
- 9 Blueberry Rd
- 24 Ships View Terrace
- 38 Old Bridge Rd
- 8 Herring Pond Rd
- 6 Aspen Rd Unit 6
- 6 Aspen Rd
- 9 F Hideaway Rd Unit 11
- 2 Beach Plum Lane U: E Ln Unit E
- 92 Sandwich Rd Unit 4-D
- E 2 Beach Plum Ln Unit E
Ask me questions while you tour the home.