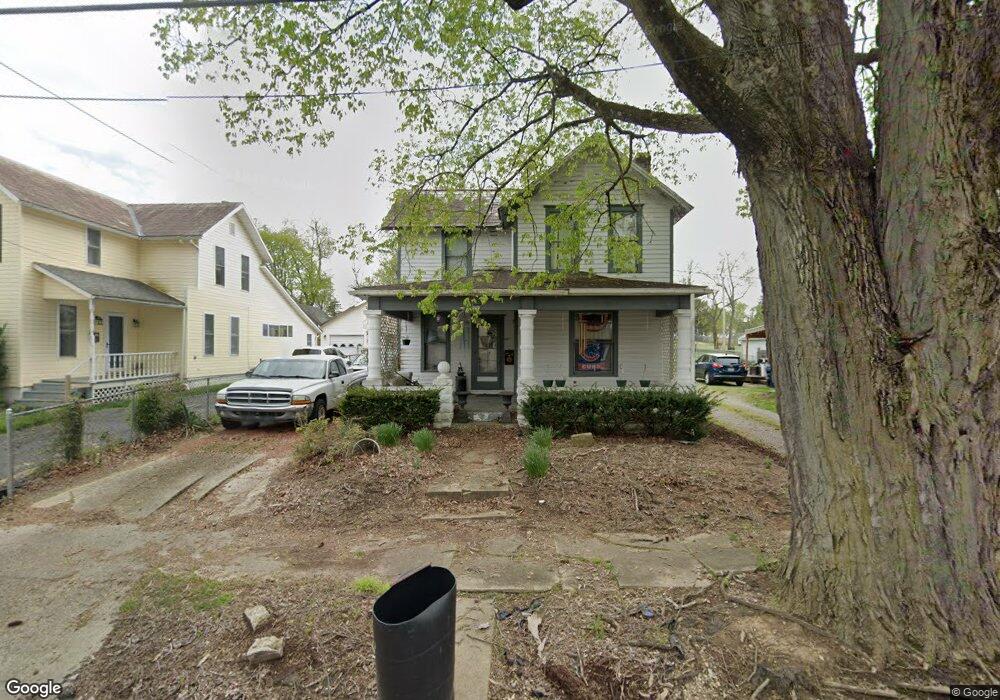
49 Summit St Newark, OH 43055
Estimated Value: $162,155 - $203,000
3
Beds
1
Bath
1,364
Sq Ft
$129/Sq Ft
Est. Value
About This Home
This home is located at 49 Summit St, Newark, OH 43055 and is currently estimated at $175,539, approximately $128 per square foot. 49 Summit St is a home located in Licking County with nearby schools including Ben Franklin Elementary School, Heritage Middle School, and Newark High School.
Ownership History
Date
Name
Owned For
Owner Type
Purchase Details
Closed on
Jul 31, 2000
Sold by
Robey Jason T
Bought by
Swigart Rodney W
Current Estimated Value
Home Financials for this Owner
Home Financials are based on the most recent Mortgage that was taken out on this home.
Original Mortgage
$50,000
Outstanding Balance
$16,400
Interest Rate
8.27%
Mortgage Type
New Conventional
Estimated Equity
$159,139
Purchase Details
Closed on
May 9, 1995
Sold by
Simpson John F
Bought by
Robey Jason T and Robey Misty L
Home Financials for this Owner
Home Financials are based on the most recent Mortgage that was taken out on this home.
Original Mortgage
$49,080
Interest Rate
8.43%
Mortgage Type
FHA
Create a Home Valuation Report for This Property
The Home Valuation Report is an in-depth analysis detailing your home's value as well as a comparison with similar homes in the area
Home Values in the Area
Average Home Value in this Area
Purchase History
We collect this data history from publicly available records. To have your information removed, we recommend requesting removal directly through your county’s website.
| Date | Buyer | Sale Price | Title Company |
|---|---|---|---|
| Swigart Rodney W | $62,500 | -- | |
| Robey Jason T | $50,000 | -- |
Source: Public Records
Mortgage History
We collect this data history from publicly available records. To have your information removed, we recommend requesting removal directly through your county’s website.
| Date | Status | Borrower | Loan Amount |
|---|---|---|---|
| Open | Swigart Rodney W | $50,000 | |
| Previous Owner | Robey Jason T | $49,080 |
Source: Public Records
Tax History
| Year | Tax Paid | Tax Assessment Tax Assessment Total Assessment is a certain percentage of the fair market value that is determined by local assessors to be the total taxable value of land and additions on the property. | Land | Improvement |
|---|---|---|---|---|
| 2025 | $1,605 | $43,720 | $5,810 | $37,910 |
| 2024 | $1,562 | $43,720 | $5,810 | $37,910 |
| 2023 | $1,561 | $43,720 | $5,810 | $37,910 |
| 2022 | $951 | $23,630 | $3,400 | $20,230 |
| 2021 | $997 | $23,630 | $3,400 | $20,230 |
| 2020 | $1,020 | $23,630 | $3,400 | $20,230 |
| 2019 | $865 | $19,290 | $2,420 | $16,870 |
| 2018 | $866 | $0 | $0 | $0 |
| 2017 | $925 | $0 | $0 | $0 |
| 2016 | $999 | $0 | $0 | $0 |
| 2015 | $1,021 | $0 | $0 | $0 |
| 2014 | $1,307 | $0 | $0 | $0 |
| 2013 | $969 | $0 | $0 | $0 |
Source: Public Records
Map
Nearby Homes
Your Personal Tour Guide
Ask me questions while you tour the home.