Estimated Value: $486,000 - $777,000
3
Beds
2
Baths
1,176
Sq Ft
$541/Sq Ft
Est. Value
About This Home
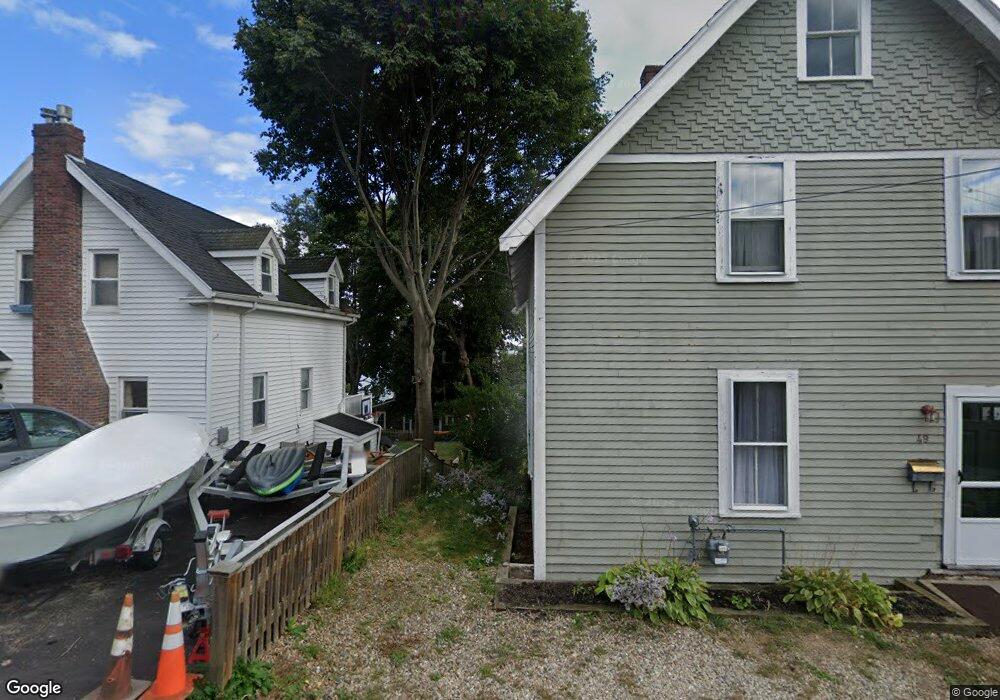
This home is located at 49 Vautrinot Ave, Hull, MA 02045 and is currently estimated at $635,820, approximately $540 per square foot. 49 Vautrinot Ave is a home located in Plymouth County with nearby schools including Lillian M. Jacobs Elementary School, Hull High School, and Memorial Middle School.
Ownership History
Date
Name
Owned For
Owner Type
Purchase Details
Closed on
Mar 9, 2016
Sold by
Craig Thomas A
Bought by
Craig Ft and Craig
Current Estimated Value
Purchase Details
Closed on
Oct 22, 2009
Sold by
Craig Thomas A and Craig Wilfred E
Bought by
Craig Thomas S and Craig Thomas E
Create a Home Valuation Report for This Property
The Home Valuation Report is an in-depth analysis detailing your home's value as well as a comparison with similar homes in the area
Purchase History
We collect this data history from publicly available records. To have your information removed, we recommend requesting removal directly through your county’s website.
| Date | Buyer | Sale Price | Title Company |
|---|---|---|---|
| Craig Ft | -- | -- | |
| Craig Thomas S | -- | -- |
Source: Public Records
Mortgage History
We collect this data history from publicly available records. To have your information removed, we recommend requesting removal directly through your county’s website.
| Date | Status | Borrower | Loan Amount |
|---|---|---|---|
| Previous Owner | Craig Thomas S | $50,000 | |
| Previous Owner | Craig Thomas S | $35,000 |
Source: Public Records
Tax History
| Year | Tax Paid | Tax Assessment Tax Assessment Total Assessment is a certain percentage of the fair market value that is determined by local assessors to be the total taxable value of land and additions on the property. | Land | Improvement |
|---|---|---|---|---|
| 2025 | $5,889 | $525,800 | $251,400 | $274,400 |
| 2024 | $5,820 | $499,600 | $236,100 | $263,500 |
| 2023 | $5,272 | $433,200 | $226,900 | $206,300 |
| 2022 | $5,289 | $421,800 | $226,900 | $194,900 |
| 2021 | $5,014 | $395,400 | $208,500 | $186,900 |
| 2020 | $4,787 | $373,400 | $208,500 | $164,900 |
| 2019 | $4,417 | $338,500 | $184,000 | $154,500 |
| 2018 | $4,333 | $322,900 | $184,000 | $138,900 |
| 2017 | $4,288 | $312,500 | $184,000 | $128,500 |
| 2016 | $4,213 | $312,500 | $184,000 | $128,500 |
| 2015 | $4,358 | $312,600 | $184,000 | $128,600 |
| 2014 | $3,995 | $288,000 | $159,400 | $128,600 |
Source: Public Records
Map
Nearby Homes
- 51 Vautrinot Ave
- 51 Vautrinot Ave
- 47 Vautrinot Ave
- 52 Highland Ave
- 61 Vautrinot Ave
- 58 Highland Ave
- 45 Vautrinot Ave
- 48 Highland Ave
- 48 Vautrinot Ave
- 63 Vautrinot Ave
- 58 Vautrinot Ave
- 44 Vautrinot Ave
- 62 Highland Ave
- 55 Highland Ave
- 53 Highland Ave
- 39 Vautrinot Ave
- 60 Vautrinot Ave
- 65 Vautrinot Ave
- 40 Highland Ave
- 51 Highland Ave
Your Personal Tour Guide
Ask me questions while you tour the home.