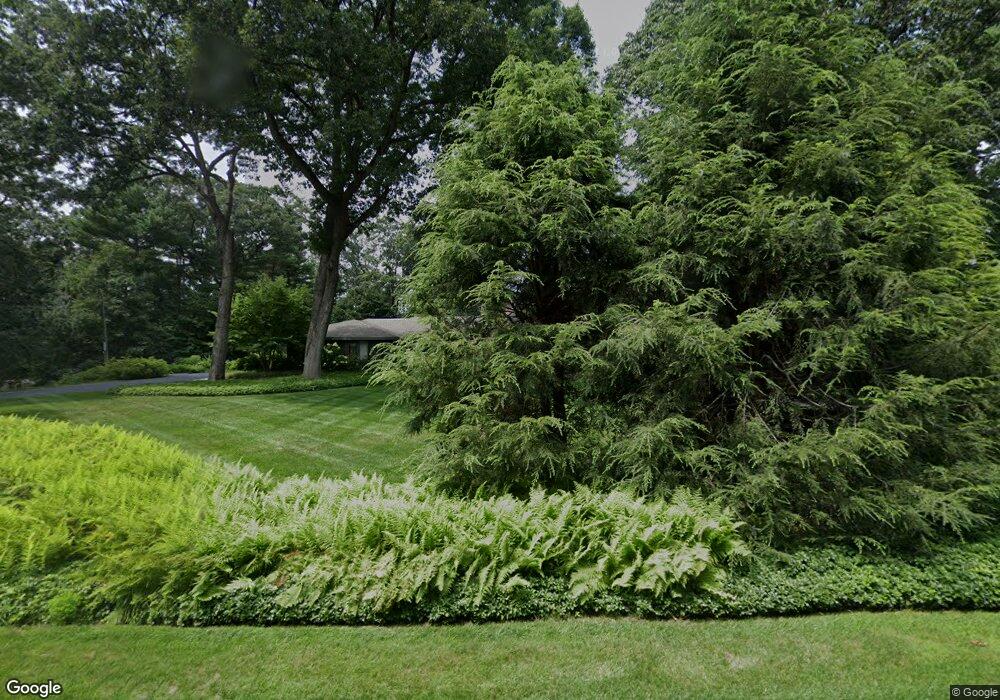
49 Westcliff Rd Weston, MA 02493
Estimated Value: $2,966,000 - $5,156,000
3
Beds
6
Baths
5,082
Sq Ft
$738/Sq Ft
Est. Value
About This Home
This home is located at 49 Westcliff Rd, Weston, MA 02493 and is currently estimated at $3,748,541, approximately $737 per square foot. 49 Westcliff Rd is a home located in Middlesex County with nearby schools including Country Elementary School, Woodland Elementary School, and Field Elementary School.
Ownership History
Date
Name
Owned For
Owner Type
Purchase Details
Closed on
Dec 9, 2024
Sold by
Glor 2007 Irt and Adams
Bought by
Ryan-Glor Sarah
Current Estimated Value
Purchase Details
Closed on
Aug 31, 2018
Sold by
Sarah Ryan Glor T and Sarah Ryan-Glor
Bought by
Glor 2007 Irt and Adams
Purchase Details
Closed on
Aug 4, 2015
Sold by
49 Westcliff Road Nt and Sutherland
Bought by
Sarah Ryan-Glor T and Sarah Ryan-Glor
Purchase Details
Closed on
May 29, 2014
Sold by
49 Westcliff Roand Nt and Abdun
Bought by
49 Westcliff Road Nt and Sutherland
Purchase Details
Closed on
Sep 22, 2009
Sold by
Abdun-Nabi Zaki and Abdun-Nabi Marguerite
Bought by
49 Westcliff Road Nt and Abdun-Nabi
Purchase Details
Closed on
Jun 28, 1991
Sold by
Mcnamar R T R and Mcnamar Karen K
Bought by
Nabi Zaki Abdun and Nabi Marguerite
Purchase Details
Closed on
Sep 7, 1990
Sold by
82 Sudbury Rd Rt
Bought by
1St Essex Sb Of N Hmps
Home Financials for this Owner
Home Financials are based on the most recent Mortgage that was taken out on this home.
Original Mortgage
$660,000
Interest Rate
9.83%
Mortgage Type
Purchase Money Mortgage
Create a Home Valuation Report for This Property
The Home Valuation Report is an in-depth analysis detailing your home's value as well as a comparison with similar homes in the area
Home Values in the Area
Average Home Value in this Area
Purchase History
We collect this data history from publicly available records. To have your information removed, we recommend requesting removal directly through your county’s website.
| Date | Buyer | Sale Price | Title Company |
|---|---|---|---|
| Ryan-Glor Sarah | $3,800,000 | None Available | |
| Ryan-Glor Sarah | $3,800,000 | None Available | |
| Glor 2007 Irt | $3,000,000 | -- | |
| Sarah Ryan-Glor T | -- | -- | |
| 49 Westcliff Road Nt | $2,200,000 | -- | |
| 49 Westcliff Road Nt | $2,200,000 | -- | |
| 49 Westcliff Road Nt | -- | -- | |
| 49 Westcliff Road Nt | -- | -- | |
| Nabi Zaki Abdun | $685,000 | -- | |
| 1St Essex Sb Of N Hmps | $730,000 | -- | |
| Mcnamar R T | $735,000 | -- | |
| Glor 2007 Irt | $3,000,000 | -- | |
| Sarah Ryan-Glor T | -- | -- | |
| 49 Westcliff Road Nt | $2,200,000 | -- | |
| 49 Westcliff Road Nt | -- | -- | |
| Nabi Zaki Abdun | $685,000 | -- | |
| Mcnamar R T | $735,000 | -- |
Source: Public Records
Mortgage History
We collect this data history from publicly available records. To have your information removed, we recommend requesting removal directly through your county’s website.
| Date | Status | Borrower | Loan Amount |
|---|---|---|---|
| Previous Owner | Mcnamar R T | $660,000 | |
| Previous Owner | Mcnamar R T | $0 |
Source: Public Records
Tax History
| Year | Tax Paid | Tax Assessment Tax Assessment Total Assessment is a certain percentage of the fair market value that is determined by local assessors to be the total taxable value of land and additions on the property. | Land | Improvement |
|---|---|---|---|---|
| 2025 | $33,504 | $3,018,400 | $1,291,600 | $1,726,800 |
| 2024 | $30,246 | $2,720,000 | $1,291,600 | $1,428,400 |
| 2023 | $29,437 | $2,486,200 | $1,291,600 | $1,194,600 |
| 2022 | $28,978 | $2,262,100 | $1,228,700 | $1,033,400 |
| 2021 | $28,008 | $2,157,800 | $1,173,500 | $984,300 |
| 2020 | $26,943 | $2,100,000 | $1,173,500 | $926,500 |
| 2019 | $26,348 | $2,092,800 | $1,173,500 | $919,300 |
| 2018 | $26,181 | $2,092,800 | $1,173,500 | $919,300 |
| 2017 | $25,951 | $2,092,800 | $1,173,500 | $919,300 |
| 2016 | $25,600 | $2,105,300 | $1,173,500 | $931,800 |
| 2015 | $20,355 | $1,657,600 | $1,118,300 | $539,300 |
Source: Public Records
Map
Nearby Homes
- 48 Scotch Pine Rd
- 300 Glen Rd
- 11 Scotch Pine Cir
- 200 Cliff Rd
- 568 Wellesley St
- 65 Woodcliff Rd
- 64 Albion Rd
- 67 Byron Rd
- 100 Albion Rd
- 451 Wellesley St
- 83 Brown St
- 24 Trailside Rd
- 153 Ridgeway Rd
- 0 Wellesley St
- 01 Wellesley St
- 206 Bristol Rd
- 22 Plymouth Rd
- 201 Lowell Rd
- 42 Edmunds Rd
- 63 Garden Rd Unit G2
- 18 Shady Hill Rd
- 8 Shady Hill Rd
- 39 Westcliff Rd
- 42 Westcliff Rd
- 24 Shady Hill Rd
- 56 Westcliff Rd
- 32 Shady Hill Rd
- 2 Shady Hill Rd
- 396 Glen Rd
- 33 Westcliff Rd
- 63 Westcliff Rd
- 21 Shady Hill Rd
- 418 Glen Rd
- 40 Shady Hill Rd
- 60 Westcliff Rd
- 25 Westcliff Rd
- 25 Westcliff Rd Unit 1
- 4 Ledgewood Rd
- 11 Shady Hill Rd
- 7 Ledgewood Rd
Your Personal Tour Guide
Ask me questions while you tour the home.