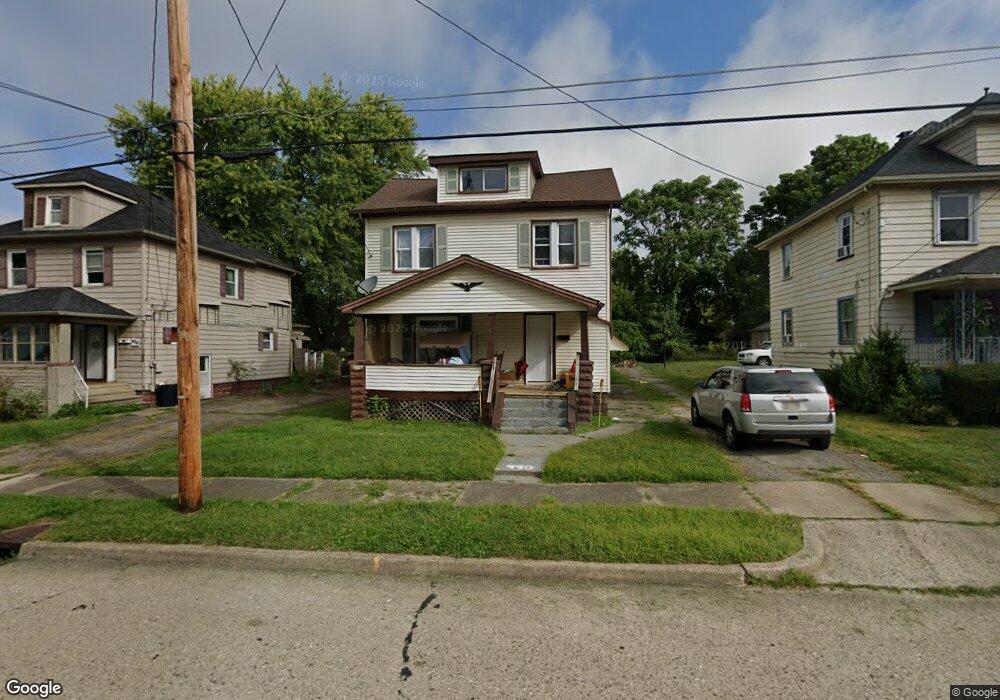
490 Devitt Ave Campbell, OH 44405
Estimated Value: $52,000 - $97,000
3
Beds
1
Bath
1,326
Sq Ft
$61/Sq Ft
Est. Value
About This Home
This home is located at 490 Devitt Ave, Campbell, OH 44405 and is currently estimated at $80,457, approximately $60 per square foot. 490 Devitt Ave is a home located in Mahoning County with nearby schools including Campbell Elementary School, Memorial High School, and Northeast Ohio Impact Academy.
Ownership History
Date
Name
Owned For
Owner Type
Purchase Details
Closed on
Dec 3, 2019
Bought by
Royland Christina
Current Estimated Value
Purchase Details
Closed on
Oct 16, 2018
Bought by
Royland Bjarnie Lie
Purchase Details
Closed on
Oct 23, 2008
Sold by
First National Bank Of Pennsylvania
Bought by
Royland Cristin
Purchase Details
Closed on
Oct 15, 2008
Sold by
Creatore Kathleen E and Brunovich Kathleen E
Bought by
First National Bank Of Pennsylvania
Purchase Details
Closed on
Oct 1, 1997
Sold by
Koulianos Nick and Koulianos Gail
Bought by
Brunovich John W and Creatore Kathleen E
Home Financials for this Owner
Home Financials are based on the most recent Mortgage that was taken out on this home.
Original Mortgage
$44,325
Interest Rate
7.54%
Purchase Details
Closed on
May 14, 1974
Bought by
Koulianos Nick and Koulianos Gail
Create a Home Valuation Report for This Property
The Home Valuation Report is an in-depth analysis detailing your home's value as well as a comparison with similar homes in the area
Home Values in the Area
Average Home Value in this Area
Purchase History
| Date | Buyer | Sale Price | Title Company |
|---|---|---|---|
| Royland Christina | -- | -- | |
| Royland Bjarnie Lie | -- | -- | |
| Royland Cristin | $15,000 | None Available | |
| First National Bank Of Pennsylvania | $28,000 | None Available | |
| Brunovich John W | $43,500 | -- | |
| Koulianos Nick | -- | -- |
Source: Public Records
Mortgage History
| Date | Status | Borrower | Loan Amount |
|---|---|---|---|
| Previous Owner | Brunovich John W | $44,325 |
Source: Public Records
Tax History
| Year | Tax Paid | Tax Assessment Tax Assessment Total Assessment is a certain percentage of the fair market value that is determined by local assessors to be the total taxable value of land and additions on the property. | Land | Improvement |
|---|---|---|---|---|
| 2025 | $694 | $12,900 | $1,360 | $11,540 |
| 2024 | $694 | $12,900 | $1,360 | $11,540 |
| 2023 | $686 | $12,900 | $1,360 | $11,540 |
| 2022 | $578 | $9,100 | $1,240 | $7,860 |
| 2021 | $1,331 | $9,100 | $1,240 | $7,860 |
| 2020 | $551 | $9,100 | $1,240 | $7,860 |
| 2019 | $570 | $8,580 | $1,170 | $7,410 |
| 2018 | $584 | $8,580 | $1,170 | $7,410 |
| 2017 | $581 | $8,580 | $1,170 | $7,410 |
| 2016 | $613 | $9,620 | $1,360 | $8,260 |
| 2015 | $601 | $9,620 | $1,360 | $8,260 |
| 2014 | $599 | $9,620 | $1,360 | $8,260 |
| 2013 | $587 | $9,620 | $1,360 | $8,260 |
Source: Public Records
Map
Nearby Homes
- 0 Penhale Ave
- 459 Tenney Ave
- 412 Whipple Ave
- 374 Tenney Ave
- 130 12th St
- 204 Tremble Ave
- 190 10th St
- 664 Tenney Ave
- 330 Sanderson Ave
- 151 Regent St
- 114 Penhale Ave
- 121 Princess St
- 541 Blossom Ave
- 165 Piccadilly St
- 159 Piccadilly St
- 667 Hyatt Ave
- 127 Blackburn St
- 0 Creed Cir Unit 5189573
- 291 Struthers Liberty Rd
- 377 Coitsville Rd
- 496 Devitt Ave
- 484 Devitt Ave
- 500 Devitt Ave
- 480 Devitt Ave
- 487 Penhale Ave
- 506 Devitt Ave
- 474 Devitt Ave
- 485 Penhale Ave
- 481 Penhale Ave
- 501 Penhale Ave
- 510 Devitt Ave
- 491 Devitt Ave
- 495 Devitt Ave
- 487 Devitt Ave
- 511 Penhale Ave
- 475 Devitt Ave
- 501 Devitt Ave
- 479 Devitt Ave
- 475 Penhale Ave
- 470 Devitt Ave
Your Personal Tour Guide
Ask me questions while you tour the home.