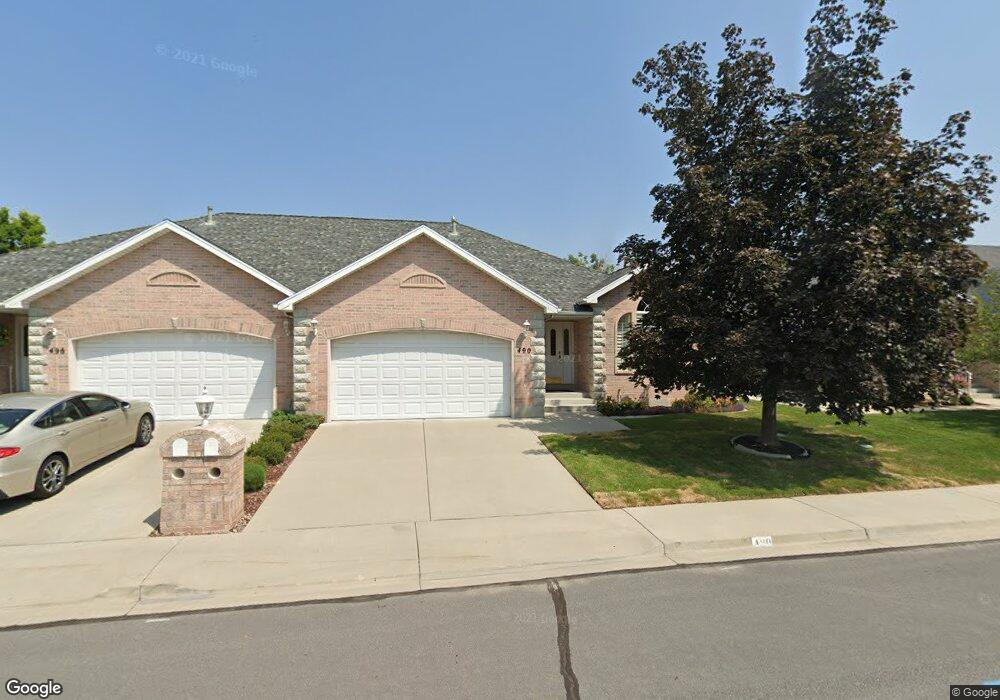
490 W 10 N Orem, UT 84057
Suncrest NeighborhoodEstimated Value: $535,000 - $595,000
5
Beds
3
Baths
3,030
Sq Ft
$183/Sq Ft
Est. Value
About This Home
This home is located at 490 W 10 N, Orem, UT 84057 and is currently estimated at $554,580, approximately $183 per square foot. 490 W 10 N is a home located in Utah County with nearby schools including Orem Junior High School, Mountain View High School, and Noah Webster Academy.
Ownership History
Date
Name
Owned For
Owner Type
Purchase Details
Closed on
Oct 13, 2014
Sold by
Strong R Scott and Strong Jane C
Bought by
Strong R Scott and Strong Jane C
Current Estimated Value
Purchase Details
Closed on
Sep 27, 2006
Sold by
Jones Ralph
Bought by
Strong R Scott and Strong Jane C
Purchase Details
Closed on
Sep 16, 2005
Sold by
Jones Ralph and Jones Lucretia
Bought by
Jones Ralph
Purchase Details
Closed on
May 25, 1999
Sold by
Adm Development Lc
Bought by
Jones Ralph and Jones Lucretia
Create a Home Valuation Report for This Property
The Home Valuation Report is an in-depth analysis detailing your home's value as well as a comparison with similar homes in the area
Home Values in the Area
Average Home Value in this Area
Purchase History
| Date | Buyer | Sale Price | Title Company |
|---|---|---|---|
| Strong R Scott | -- | None Available | |
| Strong R Scott | -- | Old Republic Title Company | |
| Jones Ralph | -- | -- | |
| Jones Ralph | -- | Mountain West Title Co |
Source: Public Records
Tax History
| Year | Tax Paid | Tax Assessment Tax Assessment Total Assessment is a certain percentage of the fair market value that is determined by local assessors to be the total taxable value of land and additions on the property. | Land | Improvement |
|---|---|---|---|---|
| 2025 | $2,336 | $282,260 | -- | -- |
| 2024 | $2,288 | $285,615 | $0 | $0 |
| 2023 | $2,288 | $300,685 | $0 | $0 |
| 2022 | $2,085 | $265,485 | $0 | $0 |
| 2021 | $1,896 | $365,700 | $75,800 | $289,900 |
| 2020 | $1,787 | $338,600 | $75,800 | $262,800 |
| 2019 | $1,559 | $307,300 | $75,800 | $231,500 |
| 2018 | $1,632 | $307,300 | $75,800 | $231,500 |
| 2017 | $1,626 | $164,010 | $0 | $0 |
| 2016 | $1,477 | $137,390 | $0 | $0 |
| 2015 | $1,494 | $131,450 | $0 | $0 |
| 2014 | $1,357 | $118,800 | $0 | $0 |
Source: Public Records
Map
Nearby Homes
Your Personal Tour Guide
Ask me questions while you tour the home.