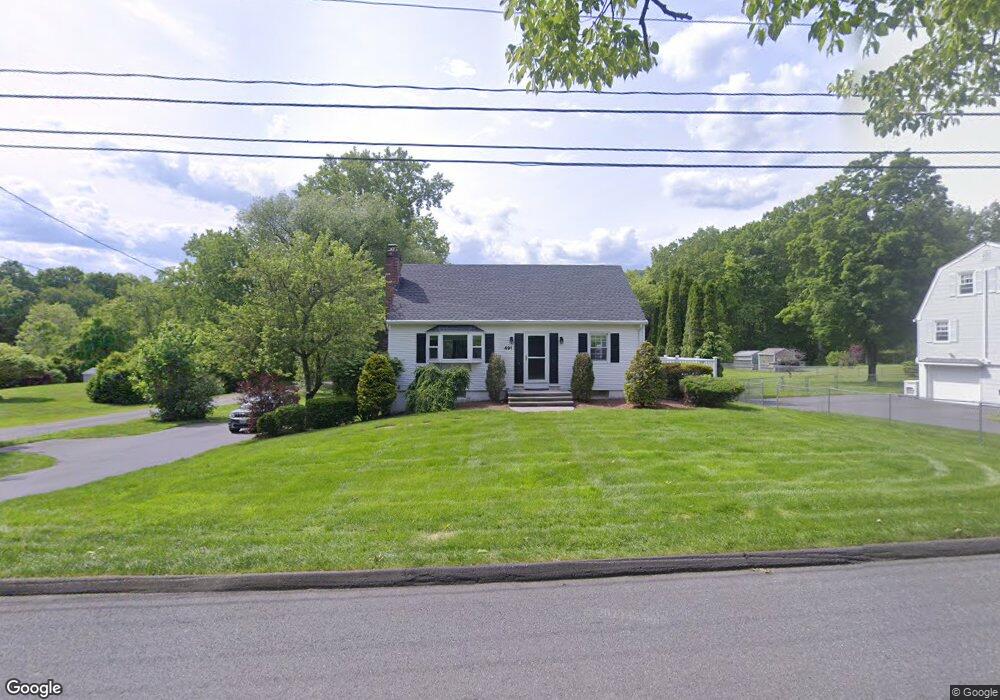
491 West Rd Westfield, MA 01085
Estimated Value: $366,510 - $450,000
About This Home
This home is located at 491 West Rd, Westfield, MA 01085 and is currently estimated at $403,378, approximately $282 per square foot. 491 West Rd is a home located in Hampden County with nearby schools including Westfield High School.
Ownership History
We collect this data history from publicly available records. To have your information removed, we recommend requesting removal directly through your county’s website.
Purchase Details
Home Financials for this Owner
Home Financials are based on the most recent Mortgage that was taken out on this home.Purchase Details
Home Financials for this Owner
Home Financials are based on the most recent Mortgage that was taken out on this home.Home Values in the Area
Average Home Value in this Area
Purchase History
We collect this data history from publicly available records. To have your information removed, we recommend requesting removal directly through your county’s website.
| Date | Buyer | Sale Price | Title Company |
|---|---|---|---|
| $134,700 | -- | ||
| $121,500 | -- |
Mortgage History
We collect this data history from publicly available records. To have your information removed, we recommend requesting removal directly through your county’s website.
| Date | Status | Borrower | Loan Amount |
|---|---|---|---|
| Open | $179,200 | ||
| Closed | $121,230 | ||
| Previous Owner | $91,125 | ||
| Previous Owner | $39,000 |
Tax History
We collect this data history from publicly available records. To have your information removed, we recommend requesting removal directly through your county’s website.
| Year | Tax Paid | Tax Assessment Tax Assessment Total Assessment is a certain percentage of the fair market value that is determined by local assessors to be the total taxable value of land and additions on the property. | Land | Improvement |
|---|---|---|---|---|
| 2025 | $4,540 | $299,100 | $118,000 | $181,100 |
| 2024 | $4,529 | $283,600 | $107,400 | $176,200 |
| 2023 | $4,212 | $256,900 | $102,400 | $154,500 |
| 2022 | $4,212 | $227,800 | $91,300 | $136,500 |
| 2021 | $4,080 | $216,100 | $86,200 | $129,900 |
| 2020 | $3,971 | $206,300 | $86,200 | $120,100 |
| 2019 | $3,881 | $197,300 | $82,100 | $115,200 |
| 2018 | $3,820 | $197,300 | $82,100 | $115,200 |
| 2017 | $3,752 | $193,200 | $83,000 | $110,200 |
| 2016 | $3,756 | $193,200 | $83,000 | $110,200 |
| 2015 | $3,493 | $188,400 | $83,000 | $105,400 |
| 2014 | $2,611 | $188,400 | $83,000 | $105,400 |
Map
- 52 & 53 Bayberry Ln
- 563 Pochassic Rd
- 1430 Russell Rd Unit 28
- 1430 Russell Rd Unit 22
- 127 Freedom Trail
- 555 Russell Rd Unit J-65
- 16 Fair Ln
- 5 4th Ave
- 9 Johns Dr
- 324 Russell Rd Unit 109
- 12 Woodland Rd
- 180 Russell Rd
- 132 North Rd
- 35 Pine St
- 32 Spruce St
- 110 Lockhouse Rd Unit I
- 32 Allen Ave
- 9 Montgomery St
- Lot 2 Nathaniel Hill
- 0 Lockhouse Rd Unit 73496193
Ask me questions while you tour the home.