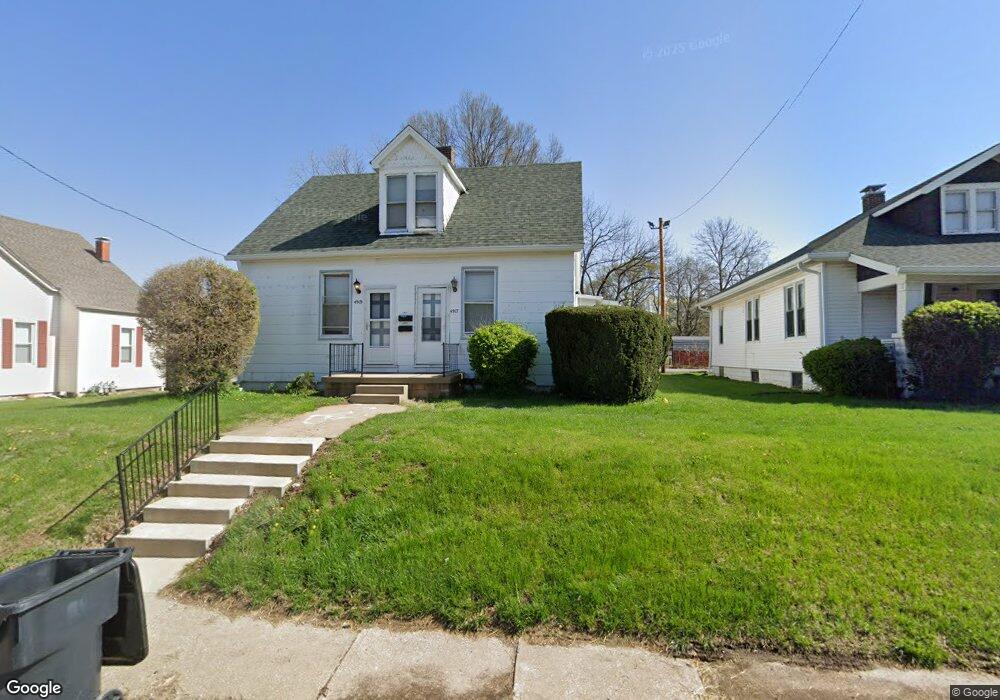
4911 W Main St Belleville, IL 62226
Estimated Value: $132,000 - $160,000
About This Home
This home is located at 4911 W Main St, Belleville, IL 62226 and is currently estimated at $145,497, approximately $121 per square foot. 4911 W Main St is a home located in St. Clair County with nearby schools including Abraham Lincoln Elementary School, West Jr High School, and Our Lady Queen Of Peace Catholic School.
Ownership History
We collect this data history from publicly available records. To have your information removed, we recommend requesting removal directly through your county’s website.
Purchase Details
Home Financials for this Owner
Home Financials are based on the most recent Mortgage that was taken out on this home.Purchase Details
Home Values in the Area
Average Home Value in this Area
Purchase History
We collect this data history from publicly available records. To have your information removed, we recommend requesting removal directly through your county’s website.
| Date | Buyer | Sale Price | Title Company |
|---|---|---|---|
| $30,000 | Fati | ||
| -- | -- |
Mortgage History
We collect this data history from publicly available records. To have your information removed, we recommend requesting removal directly through your county’s website.
| Date | Status | Borrower | Loan Amount |
|---|---|---|---|
| Closed | $24,438 |
Tax History
We collect this data history from publicly available records. To have your information removed, we recommend requesting removal directly through your county’s website.
| Year | Tax Paid | Tax Assessment Tax Assessment Total Assessment is a certain percentage of the fair market value that is determined by local assessors to be the total taxable value of land and additions on the property. | Land | Improvement |
|---|---|---|---|---|
| 2024 | $3,542 | $40,273 | $3,394 | $36,879 |
| 2023 | $3,128 | $33,324 | $3,326 | $29,998 |
| 2022 | $3,134 | $32,743 | $2,994 | $29,749 |
| 2021 | $3,018 | $30,270 | $2,768 | $27,502 |
| 2020 | $2,934 | $28,626 | $2,618 | $26,008 |
| 2019 | $2,622 | $25,312 | $2,623 | $22,689 |
| 2018 | $2,564 | $24,764 | $2,566 | $22,198 |
| 2017 | $2,544 | $24,590 | $2,548 | $22,042 |
| 2016 | $2,512 | $28,995 | $2,494 | $26,501 |
| 2014 | $2,568 | $27,777 | $2,804 | $24,973 |
| 2013 | $2,675 | $28,174 | $2,844 | $25,330 |
Map
- 4815 W Washington St
- 6 Parkridge Unit 6
- 17 S 51st St
- 18 S 52nd St
- 19 S 52nd St
- 307 N 46th St
- 161 Freedom Dr
- 325 S 52nd St
- 129 N 44th St
- 2264 Frank Scott Pkwy W
- 2245 Frank Scott Pkwy W
- 4205 S Park Dr
- 336 N 43rd St
- 21 S 57th St
- 22 Elizabeth Dr
- 100 Blue Ridge Dr
- 5912 N Belt W
- 4119 Betty Dr
- 112 Freedom Dr
- 4118 N Park Dr
Ask me questions while you tour the home.