4913 Cate Dr Waycross, GA 31503
Estimated Value: $65,260 - $222,000
4
Beds
2
Baths
2,432
Sq Ft
$53/Sq Ft
Est. Value
About This Home
This home is located at 4913 Cate Dr, Waycross, GA 31503 and is currently estimated at $128,565, approximately $52 per square foot. 4913 Cate Dr is a home with nearby schools including Wacona Elementary School, Ware County Middle School, and Ware County High School.
Create a Home Valuation Report for This Property
The Home Valuation Report is an in-depth analysis detailing your home's value as well as a comparison with similar homes in the area
Tax History
| Year | Tax Paid | Tax Assessment Tax Assessment Total Assessment is a certain percentage of the fair market value that is determined by local assessors to be the total taxable value of land and additions on the property. | Land | Improvement |
|---|---|---|---|---|
| 2025 | $320 | $12,684 | $10,160 | $2,524 |
| 2024 | $366 | $12,684 | $10,160 | $2,524 |
| 2023 | $308 | $10,646 | $8,336 | $2,310 |
| 2022 | $307 | $10,646 | $8,336 | $2,310 |
| 2021 | $284 | $9,147 | $0 | $9,147 |
| 2020 | $287 | $8,647 | $0 | $8,647 |
| 2019 | $292 | $8,698 | $0 | $8,698 |
| 2018 | $295 | $8,708 | $0 | $8,708 |
| 2017 | $527 | $9,060 | $0 | $9,060 |
| 2016 | $527 | $16,050 | $8,336 | $7,714 |
| 2015 | -- | $16,224 | $8,336 | $7,888 |
| 2014 | -- | $16,274 | $8,336 | $7,938 |
| 2013 | -- | $16,356 | $8,336 | $8,020 |
Source: Public Records
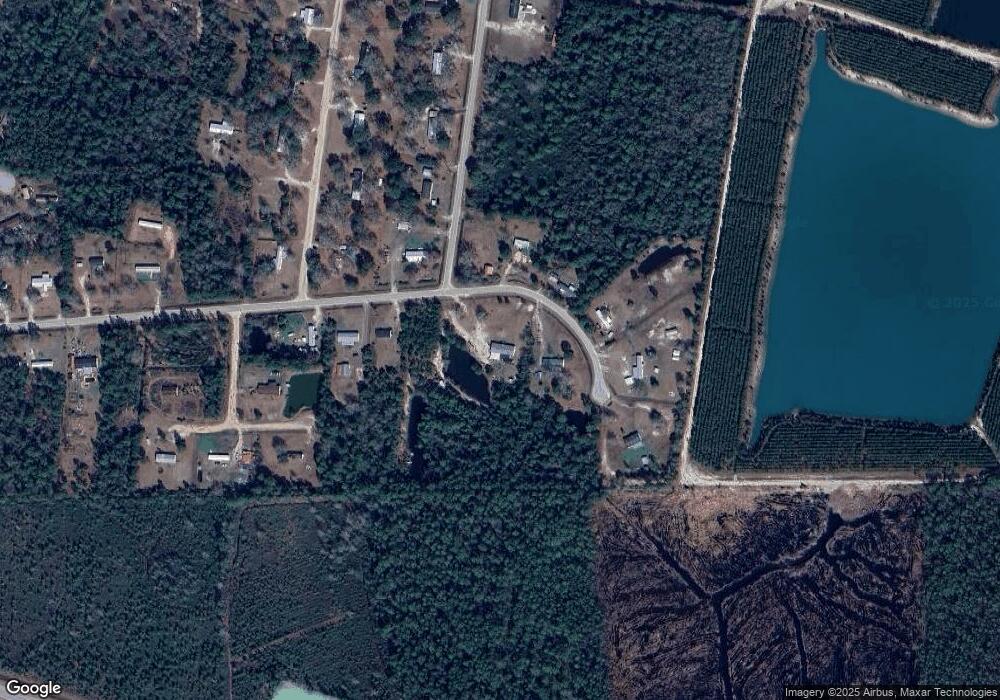
Map
Nearby Homes
- 4517 Cameron Ln
- 4609 Heidi Dr
- Lot 14 Wiregrass Ln Unit 14
- Lot 7 Wiregrass Ln Unit 7
- Lot 6 Wiregrass Ln Unit 6
- Lot 13 Wiregrass Ln Unit 13
- Lot 8 Wiregrass Ln Unit 8
- Lot 9 Wiregrass Ln Unit 9
- Lot 11 Wiregrass Ln Unit 11
- Lot 10 Wiregrass Ln Unit 10
- 4600 Alma Hwy
- 4601 Alma Hwy
- Lot 16 Wiregrass Ln Unit 16
- 4768 Lovett Rd
- 2734 Woodridge Rd
- 3670 Augusta Springs Dr
- 5625 Wooddell Dr
- 4535 Oak View Cir
- 5710 Wooddell Ridge Rd
- 2180 Fulford Rd
Your Personal Tour Guide
Ask me questions while you tour the home.