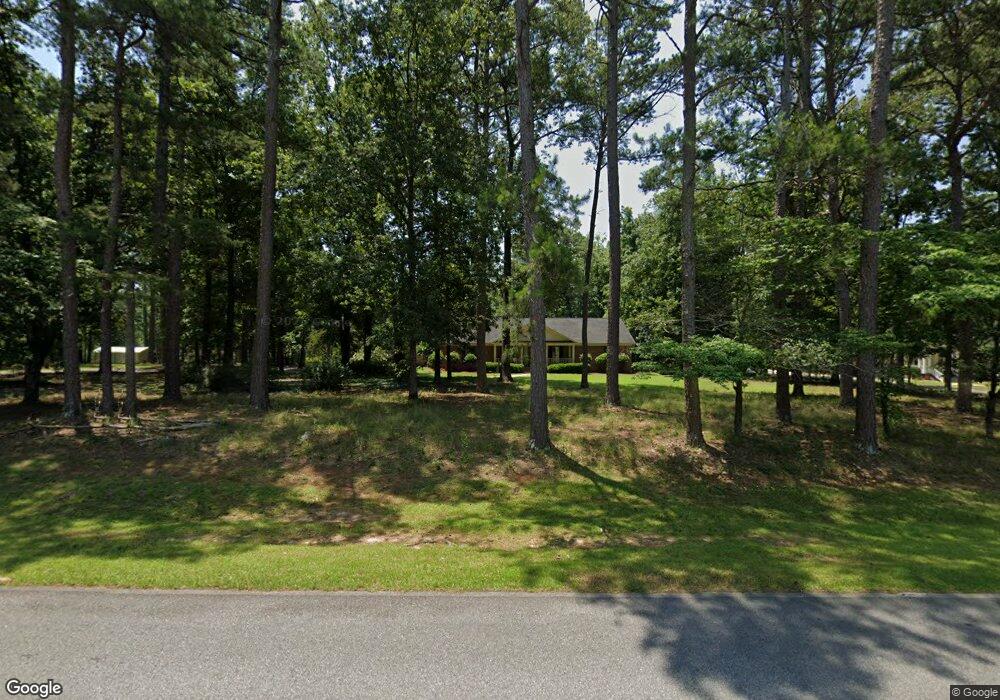
4916 van Cise Ln Albany, GA 31721
Estimated Value: $374,000 - $463,000
3
Beds
1
Bath
3,088
Sq Ft
$132/Sq Ft
Est. Value
About This Home
This home is located at 4916 van Cise Ln, Albany, GA 31721 and is currently estimated at $408,860, approximately $132 per square foot. 4916 van Cise Ln is a home located in Dougherty County with nearby schools including Live Oak Elementary School, Merry Acres Middle School, and Westover High School.
Ownership History
Date
Name
Owned For
Owner Type
Purchase Details
Closed on
Oct 4, 2024
Sold by
Broadaway Sylvia J
Bought by
Beauchamp Holdings Llc
Current Estimated Value
Home Financials for this Owner
Home Financials are based on the most recent Mortgage that was taken out on this home.
Original Mortgage
$222,358
Outstanding Balance
$218,912
Interest Rate
6.35%
Mortgage Type
New Conventional
Estimated Equity
$189,948
Purchase Details
Closed on
Oct 28, 2022
Sold by
Broadaway Charles Thomas
Bought by
Broadaway Sylvia J
Purchase Details
Closed on
Mar 6, 1995
Sold by
Carson Alenne D
Bought by
Broadaway Charles T and Broadaway Sylvia J
Purchase Details
Closed on
Jan 5, 1968
Sold by
Spearman Jerry & Va
Bought by
Carson Carson W and Carson Alenne
Create a Home Valuation Report for This Property
The Home Valuation Report is an in-depth analysis detailing your home's value as well as a comparison with similar homes in the area
Purchase History
| Date | Buyer | Sale Price | Title Company |
|---|---|---|---|
| Beauchamp Holdings Llc | $314,200 | -- | |
| Broadaway Sylvia J | -- | -- | |
| Broadaway Charles T | $39,500 | -- | |
| Carson Carson W | -- | -- |
Source: Public Records
Mortgage History
| Date | Status | Borrower | Loan Amount |
|---|---|---|---|
| Open | Beauchamp Holdings Llc | $222,358 |
Source: Public Records
Tax History
| Year | Tax Paid | Tax Assessment Tax Assessment Total Assessment is a certain percentage of the fair market value that is determined by local assessors to be the total taxable value of land and additions on the property. | Land | Improvement |
|---|---|---|---|---|
| 2025 | $5,841 | $118,800 | $8,720 | $110,080 |
| 2024 | $5,841 | $118,800 | $8,720 | $110,080 |
| 2023 | $4,368 | $118,800 | $8,720 | $110,080 |
| 2022 | $5,211 | $118,800 | $8,720 | $110,080 |
| 2021 | $4,816 | $118,800 | $8,720 | $110,080 |
| 2020 | $4,823 | $118,800 | $8,720 | $110,080 |
| 2019 | $4,834 | $118,800 | $8,720 | $110,080 |
| 2018 | $4,846 | $118,800 | $8,720 | $110,080 |
| 2017 | $4,501 | $118,800 | $8,720 | $110,080 |
| 2016 | $4,505 | $118,800 | $8,720 | $110,080 |
| 2015 | $4,507 | $118,800 | $8,720 | $110,080 |
| 2014 | $5,344 | $136,560 | $30,000 | $106,560 |
Source: Public Records
Map
Nearby Homes
- 5004 Edith Dr
- 2621 Crofton Dr
- 164 Ambleside Dr
- 4805 Millbrooke Rd
- 116 Barrondale Ct
- 4815 Marlborough Ave
- 252 Hawkstead Dr
- 4302 Old Dawson Rd
- 2700 Mccall Ct
- 112 Beowulf Ln
- 285 Hawkstead Dr
- 695 Winifred Rd
- 3812 Old Dawson Rd
- 108 Lambeth Ct
- 109 Lambeth Ct
- 136 Brompton Dr
- 112 Lambeth Ct
- 2823 W Doublegate Dr
- 116 Lambeth Ct
- 2813 W Doublegate Dr
- 4922 van Cise Ln
- 4914 van Cise Ln
- 4921 Old Dawson Rd
- 4912 van Cise Ln
- 5000 van Cise Ln
- 4917 van Cise Ln
- 4919 Old Dawson Rd
- 4917 Old Dawson Rd
- 4915 van Cise Ln
- 4910 van Cise Ln
- 4923 Old Dawson Rd
- 4913 van Cise Ln
- 4915 Old Dawson Rd
- 4919 van Cise Ln
- 5001 Old Dawson Rd
- 4913 Old Dawson Rd
- 4911 van Cise Ln
- 5004 van Cise Ln
- 5000 Old Dawson Rd
- 5002 Old Dawson Rd
Your Personal Tour Guide
Ask me questions while you tour the home.