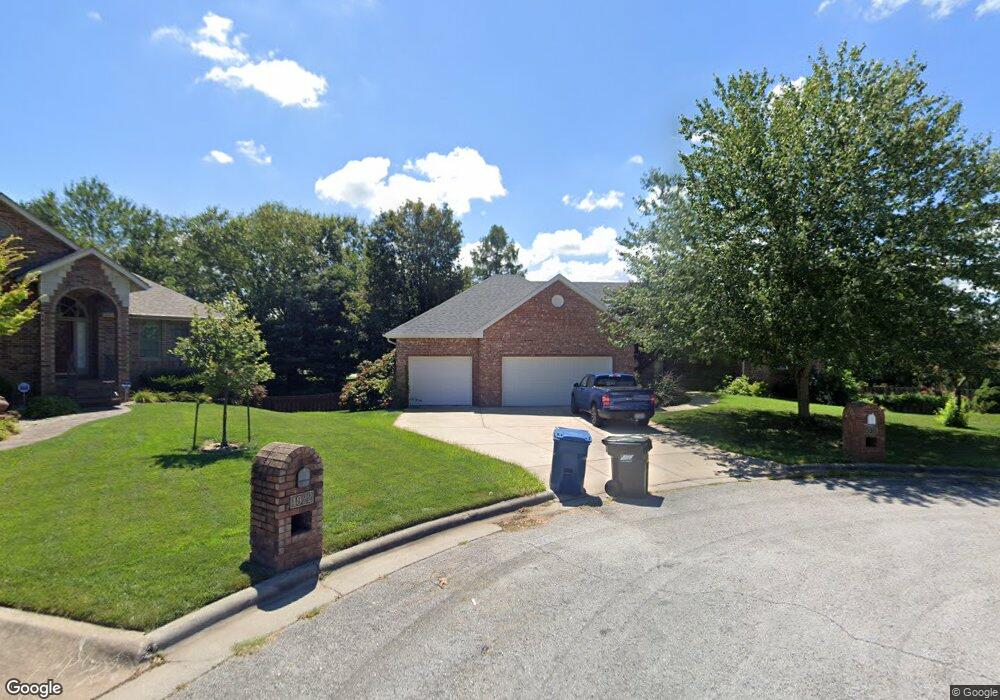
4930 S Ashford Ave Springfield, MO 65810
Southside NeighborhoodEstimated Value: $419,000 - $542,000
5
Beds
4
Baths
3,712
Sq Ft
$133/Sq Ft
Est. Value
About This Home
This home is located at 4930 S Ashford Ave, Springfield, MO 65810 and is currently estimated at $495,452, approximately $133 per square foot. 4930 S Ashford Ave is a home located in Greene County with nearby schools including Walt Disney Elementary School, Cherokee Middle School, and Kickapoo High School.
Ownership History
Date
Name
Owned For
Owner Type
Purchase Details
Closed on
Oct 4, 2011
Sold by
Breese James M and Breese Tresa L
Bought by
Courtney Chad and Courtney Angie
Current Estimated Value
Home Financials for this Owner
Home Financials are based on the most recent Mortgage that was taken out on this home.
Original Mortgage
$278,825
Outstanding Balance
$191,812
Interest Rate
4.28%
Mortgage Type
New Conventional
Estimated Equity
$303,640
Create a Home Valuation Report for This Property
The Home Valuation Report is an in-depth analysis detailing your home's value as well as a comparison with similar homes in the area
Home Values in the Area
Average Home Value in this Area
Purchase History
| Date | Buyer | Sale Price | Title Company |
|---|---|---|---|
| Courtney Chad | -- | None Available |
Source: Public Records
Mortgage History
| Date | Status | Borrower | Loan Amount |
|---|---|---|---|
| Open | Courtney Chad | $278,825 |
Source: Public Records
Tax History
| Year | Tax Paid | Tax Assessment Tax Assessment Total Assessment is a certain percentage of the fair market value that is determined by local assessors to be the total taxable value of land and additions on the property. | Land | Improvement |
|---|---|---|---|---|
| 2025 | $3,878 | $77,830 | $9,540 | $68,290 |
| 2024 | $3,605 | $67,190 | $6,940 | $60,250 |
| 2023 | $3,584 | $67,190 | $6,940 | $60,250 |
| 2022 | $3,238 | $59,300 | $6,940 | $52,360 |
| 2021 | $3,238 | $59,300 | $6,940 | $52,360 |
| 2020 | $3,271 | $57,270 | $6,940 | $50,330 |
| 2019 | $3,178 | $57,270 | $6,940 | $50,330 |
| 2018 | $2,856 | $51,480 | $6,940 | $44,540 |
| 2017 | $2,827 | $50,340 | $6,940 | $43,400 |
| 2016 | $2,759 | $50,340 | $6,940 | $43,400 |
| 2015 | $2,734 | $50,340 | $6,940 | $43,400 |
| 2014 | $2,652 | $48,490 | $6,940 | $41,550 |
Source: Public Records
Map
Nearby Homes
- 5150 S Dollison Ave
- 5112 S Hampton Ave
- 5155 S Hampton Ave
- 4959 S Mccann Ave
- 4904 S Mccann Ave
- 930 E Canterbury St
- 5252 S Holland Ave
- 719 E Westchester Ct
- 1354 E Sammy Ln
- 1264 E Lafayette Ct
- 377 E Degraffenreid St
- 5456 S Hazel Ave
- 1221 E Knobhill St
- 680 E Trakel Place
- 4921 S Aaron Ave
- 5996 S Holland Ave
- 319 E Farm Road 182
- 1309 E Knobhill St
- Lots 17 S Clay Ave
- Lots 16 S Clay Ave
- 4922 S Ashford Ave
- 4929 S Ashford Ave
- 4927 S Stanton Ave
- 4931 S Stanton Ave
- 4914 S Ashford Ave
- 5021 S Virginia Ct
- 4921 S Ashford Ave
- 4917 S Stanton Ave
- 5020 S Virginia Ct
- 4913 S Ashford Ave
- 905 E National Place Blvd
- 5031 S Virginia Ct
- 4927 S Stanton Dr
- 4917 S Stanton Dr
- 4906 S Ashford Ave
- 4911 S Stanton Ave
- 4905 S Ashford Ave
- 915 E National Place Blvd
- 4930 S Stanton Ave
- 5030 S Virginia Ct
Your Personal Tour Guide
Ask me questions while you tour the home.