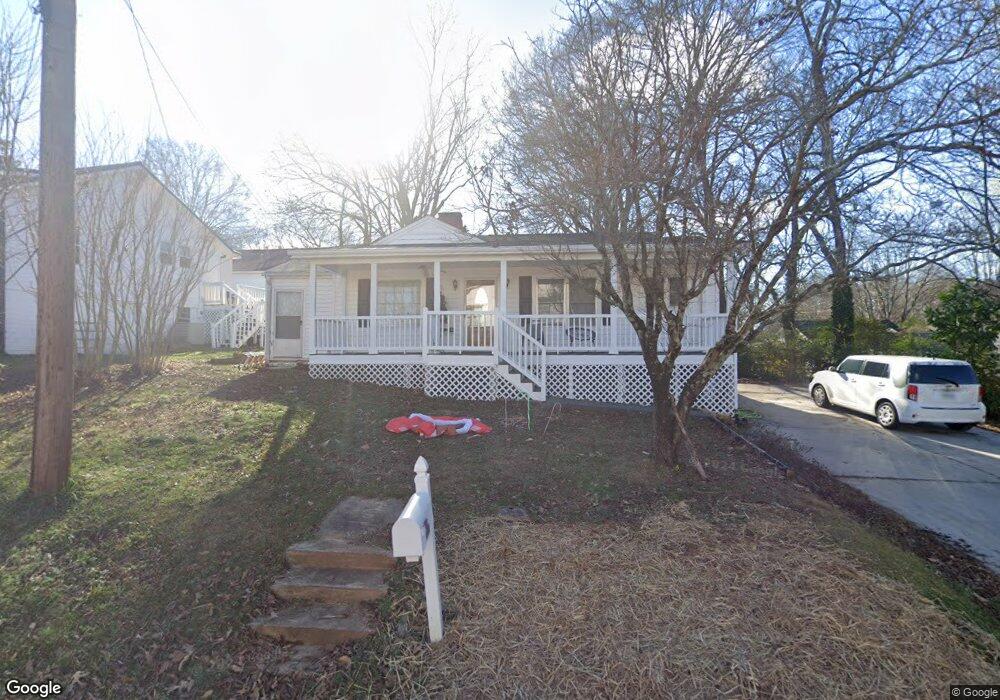
4940 N Lee St Buford, GA 30518
Estimated Value: $260,000 - $292,701
2
Beds
1
Bath
1,093
Sq Ft
$253/Sq Ft
Est. Value
About This Home
This home is located at 4940 N Lee St, Buford, GA 30518 and is currently estimated at $276,675, approximately $253 per square foot. 4940 N Lee St is a home located in Gwinnett County with nearby schools including Buford Elementary School, Buford Senior Academy, and Buford Academy.
Ownership History
Date
Name
Owned For
Owner Type
Purchase Details
Closed on
Sep 29, 1998
Sold by
King Robert L
Bought by
Smith Angelia K
Current Estimated Value
Home Financials for this Owner
Home Financials are based on the most recent Mortgage that was taken out on this home.
Original Mortgage
$64,950
Outstanding Balance
$13,408
Interest Rate
6.8%
Mortgage Type
New Conventional
Estimated Equity
$263,267
Purchase Details
Closed on
Mar 6, 1998
Sold by
King Linda M
Bought by
King Robert L
Create a Home Valuation Report for This Property
The Home Valuation Report is an in-depth analysis detailing your home's value as well as a comparison with similar homes in the area
Home Values in the Area
Average Home Value in this Area
Purchase History
We collect this data history from publicly available records. To have your information removed, we recommend requesting removal directly through your county’s website.
| Date | Buyer | Sale Price | Title Company |
|---|---|---|---|
| Smith Angelia K | $67,000 | -- | |
| King Robert L | -- | -- |
Source: Public Records
Mortgage History
We collect this data history from publicly available records. To have your information removed, we recommend requesting removal directly through your county’s website.
| Date | Status | Borrower | Loan Amount |
|---|---|---|---|
| Open | Smith Angelia K | $64,950 |
Source: Public Records
Tax History
| Year | Tax Paid | Tax Assessment Tax Assessment Total Assessment is a certain percentage of the fair market value that is determined by local assessors to be the total taxable value of land and additions on the property. | Land | Improvement |
|---|---|---|---|---|
| 2025 | $1,507 | $105,000 | $40,000 | $65,000 |
| 2024 | $1,465 | $102,080 | $33,600 | $68,480 |
| 2023 | $1,465 | $77,560 | $26,000 | $51,560 |
| 2022 | $1,113 | $77,560 | $26,000 | $51,560 |
| 2021 | $688 | $47,960 | $16,800 | $31,160 |
| 2020 | $688 | $47,960 | $16,800 | $31,160 |
| 2019 | $622 | $47,960 | $16,800 | $31,160 |
| 2018 | $330 | $25,440 | $5,600 | $19,840 |
| 2016 | $326 | $25,440 | $5,600 | $19,840 |
| 2015 | $338 | $25,440 | $5,600 | $19,840 |
| 2014 | $323 | $23,920 | $5,600 | $18,320 |
Source: Public Records
Map
Nearby Homes
- 490 Jackson St
- 1769 Rowland Pass
- 151 N Church St
- 165 Kennesaw St
- 230 Wilbanks St
- 169 W Park St
- 240 Wilbanks St
- 250 Wilbanks St
- 260 Wilbanks St
- 120 Poplar St
- 110 Poplar St
- 168 Poplar St
- 59 Spring St
- 425 Church St
- 29 E Park St
- 294 Watson St
- 172 E Shadburn Ave
- 440 S Alexander St
- 108 Woodland St
- 120 N Gwinnett St
Your Personal Tour Guide
Ask me questions while you tour the home.