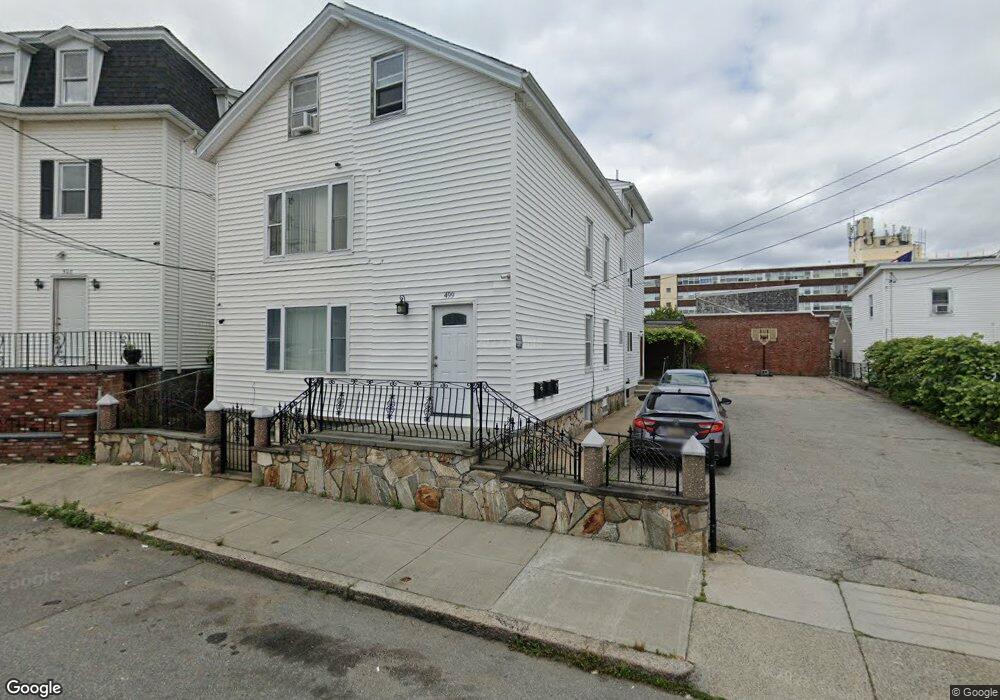
499 3rd St Fall River, MA 02721
Corky Row NeighborhoodEstimated Value: $497,000 - $749,000
9
Beds
3
Baths
3,698
Sq Ft
$174/Sq Ft
Est. Value
About This Home
This home is located at 499 3rd St, Fall River, MA 02721 and is currently estimated at $643,000, approximately $173 per square foot. 499 3rd St is a home located in Bristol County with nearby schools including Henry Lord Community School, B M C Durfee High School, and Argosy Collegiate Charter School.
Ownership History
Date
Name
Owned For
Owner Type
Purchase Details
Closed on
Oct 1, 2019
Sold by
Amaral Ft and Amaral
Bought by
Dias Elisabete C and Dias Eric A
Current Estimated Value
Home Financials for this Owner
Home Financials are based on the most recent Mortgage that was taken out on this home.
Original Mortgage
$190,000
Outstanding Balance
$164,221
Interest Rate
3.6%
Mortgage Type
New Conventional
Estimated Equity
$478,779
Purchase Details
Closed on
Jun 21, 2007
Sold by
Amaral Helena
Bought by
Amaral Ft and Amaral
Purchase Details
Closed on
Jun 8, 2007
Sold by
Amaral Manuel and Amaral Maria N
Bought by
Amaral Helena and Amaral Manuel
Purchase Details
Closed on
Dec 8, 1989
Sold by
Dias Angelo
Bought by
Amaral Manuel
Create a Home Valuation Report for This Property
The Home Valuation Report is an in-depth analysis detailing your home's value as well as a comparison with similar homes in the area
Home Values in the Area
Average Home Value in this Area
Purchase History
We collect this data history from publicly available records. To have your information removed, we recommend requesting removal directly through your county’s website.
| Date | Buyer | Sale Price | Title Company |
|---|---|---|---|
| Dias Elisabete C | $200,000 | -- | |
| Amaral Ft | -- | -- | |
| Amaral Ft | -- | -- | |
| Amaral Helena | -- | -- | |
| Amaral Helena | -- | -- | |
| Amaral Manuel | $90,000 | -- | |
| Amaral Manuel | $90,000 | -- |
Source: Public Records
Mortgage History
We collect this data history from publicly available records. To have your information removed, we recommend requesting removal directly through your county’s website.
| Date | Status | Borrower | Loan Amount |
|---|---|---|---|
| Open | Dias Elisabete C | $190,000 | |
| Previous Owner | Amaral Manuel | $5,000 | |
| Previous Owner | Amaral Manuel | $8,850 |
Source: Public Records
Tax History
| Year | Tax Paid | Tax Assessment Tax Assessment Total Assessment is a certain percentage of the fair market value that is determined by local assessors to be the total taxable value of land and additions on the property. | Land | Improvement |
|---|---|---|---|---|
| 2025 | $5,665 | $494,800 | $104,500 | $390,300 |
| 2024 | $5,384 | $468,600 | $97,600 | $371,000 |
| 2023 | $4,771 | $388,800 | $81,900 | $306,900 |
| 2022 | $4,223 | $334,600 | $78,000 | $256,600 |
| 2021 | $3,845 | $278,000 | $74,600 | $203,400 |
| 2020 | $3,380 | $233,900 | $72,200 | $161,700 |
| 2019 | $2,916 | $200,000 | $72,200 | $127,800 |
| 2018 | $2,788 | $190,700 | $76,500 | $114,200 |
| 2017 | $2,670 | $190,700 | $76,500 | $114,200 |
| 2016 | $2,791 | $204,800 | $93,600 | $111,200 |
| 2015 | $2,632 | $201,200 | $90,000 | $111,200 |
| 2014 | $2,795 | $222,200 | $99,900 | $122,300 |
Source: Public Records
Map
Nearby Homes
Your Personal Tour Guide
Ask me questions while you tour the home.