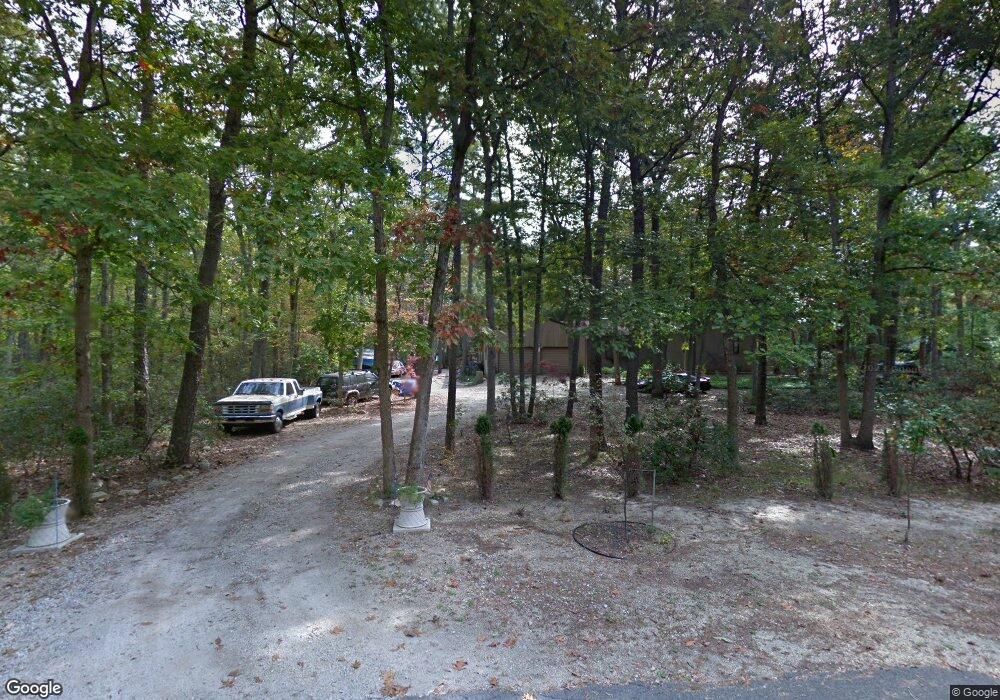
5 Bishop Rd Tabernacle, NJ 08088
Estimated Value: $470,000 - $541,000
4
Beds
3
Baths
2,072
Sq Ft
$245/Sq Ft
Est. Value
About This Home
This home is located at 5 Bishop Rd, Tabernacle, NJ 08088 and is currently estimated at $507,572, approximately $244 per square foot. 5 Bishop Rd is a home located in Burlington County with nearby schools including Tabernacle Elementary School, Kenneth R Olson Mid School, and Seneca High School.
Ownership History
Date
Name
Owned For
Owner Type
Purchase Details
Closed on
Jul 30, 2010
Sold by
Lalli Pasquale J
Bought by
Coxe Patrick E and Coxe Suzanne M
Current Estimated Value
Purchase Details
Closed on
Jun 19, 2003
Sold by
Frost Barry W
Bought by
Lalli Anthony J
Home Financials for this Owner
Home Financials are based on the most recent Mortgage that was taken out on this home.
Original Mortgage
$175,000
Interest Rate
5.46%
Mortgage Type
Purchase Money Mortgage
Purchase Details
Closed on
Apr 28, 1994
Sold by
Johnson Roger W and Johnson Dianne B
Bought by
Johnson Dianne B
Create a Home Valuation Report for This Property
The Home Valuation Report is an in-depth analysis detailing your home's value as well as a comparison with similar homes in the area
Home Values in the Area
Average Home Value in this Area
Purchase History
| Date | Buyer | Sale Price | Title Company |
|---|---|---|---|
| Coxe Patrick E | $250,000 | None Available | |
| Lalli Anthony J | $225,000 | -- | |
| Johnson Dianne B | -- | -- |
Source: Public Records
Mortgage History
| Date | Status | Borrower | Loan Amount |
|---|---|---|---|
| Previous Owner | Lalli Anthony J | $175,000 |
Source: Public Records
Tax History
| Year | Tax Paid | Tax Assessment Tax Assessment Total Assessment is a certain percentage of the fair market value that is determined by local assessors to be the total taxable value of land and additions on the property. | Land | Improvement |
|---|---|---|---|---|
| 2025 | $7,816 | $236,000 | $55,000 | $181,000 |
| 2024 | $7,160 | $236,000 | $55,000 | $181,000 |
| 2023 | $7,160 | $236,000 | $55,000 | $181,000 |
| 2022 | $6,943 | $236,000 | $55,000 | $181,000 |
| 2021 | $6,338 | $236,000 | $55,000 | $181,000 |
| 2020 | $7,158 | $236,000 | $55,000 | $181,000 |
| 2019 | $6,943 | $236,000 | $55,000 | $181,000 |
| 2018 | $6,816 | $236,000 | $55,000 | $181,000 |
| 2017 | $6,773 | $236,000 | $55,000 | $181,000 |
| 2016 | $6,563 | $236,000 | $55,000 | $181,000 |
| 2015 | $6,507 | $236,000 | $55,000 | $181,000 |
| 2014 | $6,249 | $236,000 | $55,000 | $181,000 |
Source: Public Records
Map
Nearby Homes
- 1666 Route 206
- 22 Richter Rd
- 45 Lakeview Dr
- 52 Summit Dr
- 66 Summit Dr
- 18 Forest Ln
- 4 Allen Ct
- 32 Constitution Dr
- 50 Constitution Dr
- 49 Magnolia Ln
- 83 Holly Ct
- 19 Sandra Ln
- 42 Mockingbird Way
- 0 Stevenson Unit NJBL2105846
- 13 Mallard Dr
- 18 Waltham Dr
- 7 Mallard Dr
- 1826 U S 206
- 4 Wimbeldon Way
- 405 New Rd
- 3 Bishop Rd
- 9 Moore Rd W
- 19 Moore Rd W
- 7 Moore Rd W
- 5 Moore Rd W
- 15 Moore Rd W
- 10 Moore Rd W
- 14 Moore Rd W
- 4 Mark Ln
- 407 Old Indian Mills Rd
- 12 Moore Rd W
- 8 Moore Rd W
- 405 Old Indian Mills Rd
- 409 Old Indian Mills Rd
- 6 Moore Rd W
- 20 Moore Rd W
- 16 Moore Rd W
- 4 Moore Rd W
- 403 Old Indian Mills Rd
- 18 Moore Rd W
Your Personal Tour Guide
Ask me questions while you tour the home.