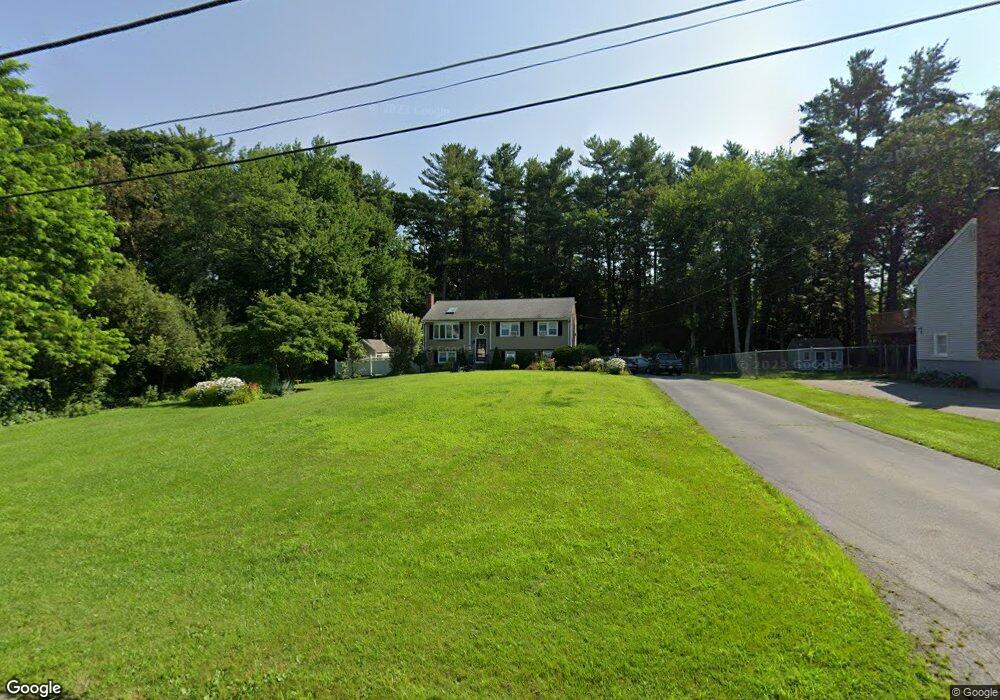
5 Boyle St Wilmington, MA 01887
Estimated Value: $663,000 - $838,000
3
Beds
2
Baths
1,176
Sq Ft
$630/Sq Ft
Est. Value
About This Home
This home is located at 5 Boyle St, Wilmington, MA 01887 and is currently estimated at $740,917, approximately $630 per square foot. 5 Boyle St is a home located in Middlesex County with nearby schools including Wilmington Middle School and Wilmington High School.
Ownership History
Date
Name
Owned For
Owner Type
Purchase Details
Closed on
Mar 13, 2026
Sold by
Mason Paul and Mason Jennifer C
Bought by
Mason
Current Estimated Value
Purchase Details
Closed on
Aug 22, 2016
Sold by
Marcou Steven and Marcou Kelli A
Bought by
Mason Paul and Mason Jennifer C
Home Financials for this Owner
Home Financials are based on the most recent Mortgage that was taken out on this home.
Original Mortgage
$403,683
Interest Rate
3.41%
Mortgage Type
VA
Create a Home Valuation Report for This Property
The Home Valuation Report is an in-depth analysis detailing your home's value as well as a comparison with similar homes in the area
Purchase History
| Date | Buyer | Sale Price | Title Company |
|---|---|---|---|
| Mason | -- | -- | |
| Mason Paul | $443,000 | -- |
Source: Public Records
Mortgage History
| Date | Status | Borrower | Loan Amount |
|---|---|---|---|
| Previous Owner | Mason Paul | $403,683 |
Source: Public Records
Tax History
| Year | Tax Paid | Tax Assessment Tax Assessment Total Assessment is a certain percentage of the fair market value that is determined by local assessors to be the total taxable value of land and additions on the property. | Land | Improvement |
|---|---|---|---|---|
| 2025 | $7,744 | $676,300 | $297,800 | $378,500 |
| 2024 | $7,681 | $672,000 | $297,800 | $374,200 |
| 2023 | $7,431 | $622,400 | $270,700 | $351,700 |
| 2022 | $7,095 | $544,500 | $225,500 | $319,000 |
| 2021 | $6,981 | $504,400 | $205,000 | $299,400 |
| 2020 | $7,096 | $522,500 | $205,000 | $317,500 |
| 2019 | $6,545 | $476,000 | $195,300 | $280,700 |
| 2018 | $6,136 | $425,800 | $186,000 | $239,800 |
| 2017 | $5,617 | $388,700 | $186,000 | $202,700 |
| 2016 | $5,325 | $364,000 | $177,200 | $186,800 |
| 2015 | $5,071 | $352,900 | $177,200 | $175,700 |
| 2014 | $4,770 | $335,000 | $168,800 | $166,200 |
Source: Public Records
Map
Nearby Homes
Your Personal Tour Guide
Ask me questions while you tour the home.