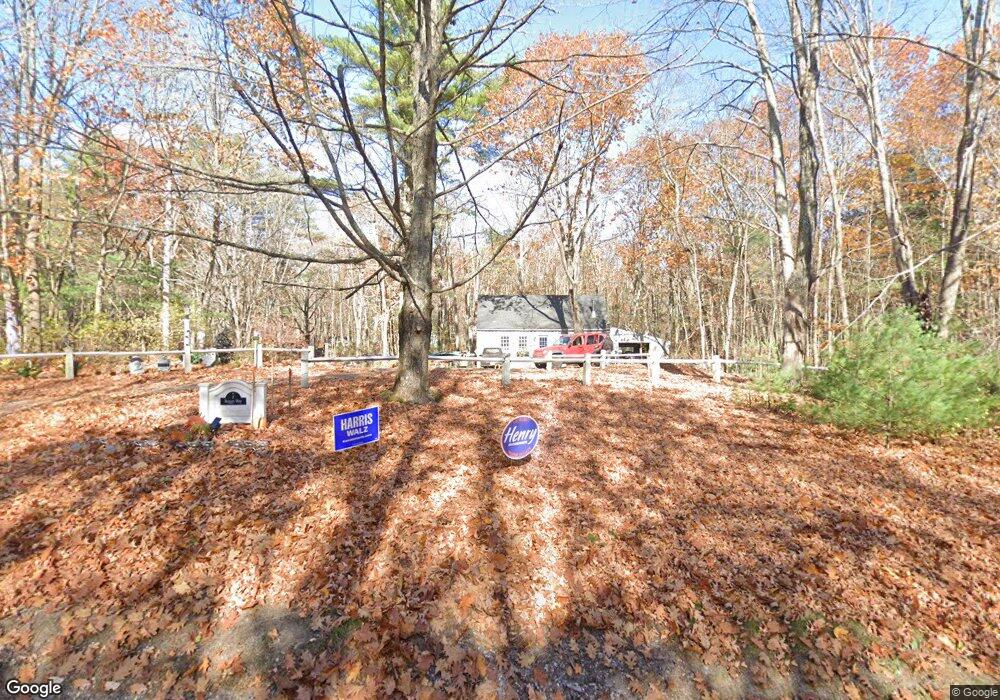
5 Briggs Way Lyman, ME 04002
Lyman NeighborhoodEstimated Value: $388,504 - $493,000
About This Home
This home is located at 5 Briggs Way, Lyman, ME 04002 and is currently estimated at $451,168, approximately $335 per square foot. 5 Briggs Way is a home with nearby schools including Massabesic High School.
Ownership History
We collect this data history from publicly available records. To have your information removed, we recommend requesting removal directly through your county’s website.
Purchase Details
Home Financials for this Owner
Home Financials are based on the most recent Mortgage that was taken out on this home.Home Values in the Area
Average Home Value in this Area
Purchase History
We collect this data history from publicly available records. To have your information removed, we recommend requesting removal directly through your county’s website.
| Date | Buyer | Sale Price | Title Company |
|---|---|---|---|
| -- | -- |
Mortgage History
We collect this data history from publicly available records. To have your information removed, we recommend requesting removal directly through your county’s website.
| Date | Status | Borrower | Loan Amount |
|---|---|---|---|
| Open | $161,000 |
Tax History
We collect this data history from publicly available records. To have your information removed, we recommend requesting removal directly through your county’s website.
| Year | Tax Paid | Tax Assessment Tax Assessment Total Assessment is a certain percentage of the fair market value that is determined by local assessors to be the total taxable value of land and additions on the property. | Land | Improvement |
|---|---|---|---|---|
| 2025 | $3,116 | $224,000 | $80,000 | $144,000 |
| 2024 | $2,825 | $224,000 | $80,000 | $144,000 |
| 2023 | $2,731 | $224,000 | $80,000 | $144,000 |
| 2022 | $2,621 | $224,000 | $80,000 | $144,000 |
| 2021 | $2,572 | $224,000 | $80,000 | $144,000 |
| 2020 | $2,344 | $218,000 | $81,000 | $137,000 |
| 2019 | $2,282 | $218,000 | $81,000 | $137,000 |
| 2018 | $2,251 | $186,000 | $68,000 | $118,000 |
| 2017 | $2,128 | $170,400 | $62,500 | $107,900 |
| 2015 | $2,113 | $170,400 | $62,500 | $107,900 |
| 2014 | $2,070 | $170,400 | $62,500 | $107,900 |
Map
- 062-2 S Waterboro Rd
- 63 Poor Farm Rd
- 72 W Shore Dr
- 251 Poor Farm Rd
- 11 Ray Ave
- 283 Davis Rd
- 89 Deering Ridge Rd
- 65 Old County Rd
- 296 Wadleigh Pond Rd
- 80 Raegan Lynn Rd
- 19 Day Rd
- 193 Barkers Pond Rd
- 67 Barkers Pond Rd
- 129 Barkers Pond Rd
- TBD Revere Way
- 98 Goodwins Mills Rd
- 74 Goodwins Mills Rd
- 10 Lost Tree Ln
- 660 Goodwins Mills Rd
- 2252 Alfred Rd
Ask me questions while you tour the home.