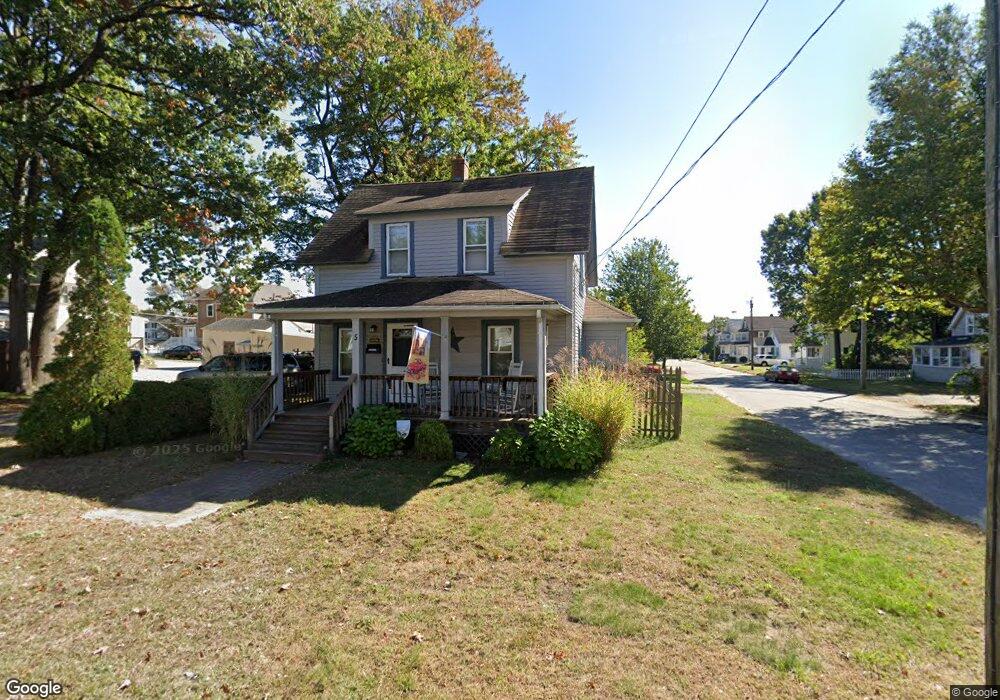
5 David St Springfield, MA 01104
Liberty Heights NeighborhoodEstimated Value: $242,350 - $306,000
3
Beds
1
Bath
1,323
Sq Ft
$204/Sq Ft
Est. Value
About This Home
This home is located at 5 David St, Springfield, MA 01104 and is currently estimated at $269,588, approximately $203 per square foot. 5 David St is a home located in Hampden County with nearby schools including Glenwood School, Van Sickle Academy, and High School Of Commerce.
Ownership History
Date
Name
Owned For
Owner Type
Purchase Details
Closed on
Jun 14, 1999
Sold by
Buynicki Stephen M
Bought by
Moore John W
Current Estimated Value
Home Financials for this Owner
Home Financials are based on the most recent Mortgage that was taken out on this home.
Original Mortgage
$56,600
Interest Rate
6.9%
Mortgage Type
Purchase Money Mortgage
Create a Home Valuation Report for This Property
The Home Valuation Report is an in-depth analysis detailing your home's value as well as a comparison with similar homes in the area
Home Values in the Area
Average Home Value in this Area
Purchase History
We collect this data history from publicly available records. To have your information removed, we recommend requesting removal directly through your county’s website.
| Date | Buyer | Sale Price | Title Company |
|---|---|---|---|
| Moore John W | $33,750 | -- |
Source: Public Records
Mortgage History
We collect this data history from publicly available records. To have your information removed, we recommend requesting removal directly through your county’s website.
| Date | Status | Borrower | Loan Amount |
|---|---|---|---|
| Open | Moore John W | $63,000 | |
| Closed | Moore John W | $56,600 |
Source: Public Records
Tax History
| Year | Tax Paid | Tax Assessment Tax Assessment Total Assessment is a certain percentage of the fair market value that is determined by local assessors to be the total taxable value of land and additions on the property. | Land | Improvement |
|---|---|---|---|---|
| 2025 | $3,152 | $201,000 | $36,500 | $164,500 |
| 2024 | $3,172 | $197,500 | $36,500 | $161,000 |
| 2023 | $3,405 | $199,700 | $32,300 | $167,400 |
| 2022 | $2,723 | $144,700 | $30,200 | $114,500 |
| 2021 | $2,686 | $142,100 | $27,400 | $114,700 |
| 2020 | $2,680 | $137,200 | $27,400 | $109,800 |
| 2019 | $2,395 | $121,700 | $29,800 | $91,900 |
| 2018 | $2,240 | $113,800 | $29,800 | $84,000 |
| 2017 | $2,255 | $114,700 | $27,000 | $87,700 |
| 2016 | $2,326 | $118,300 | $25,600 | $92,700 |
| 2015 | $2,331 | $118,500 | $25,600 | $92,900 |
Source: Public Records
Map
Nearby Homes
- 70 Norman St
- 907-909 Liberty St
- 127 Governor St
- 130 Connecticut Ave
- 115 Connecticut Ave
- 78 Governor St
- 774-776 Liberty St
- 38 Phoenix St
- 138 Wilber St
- 585 Armory St
- 105 Wilber St
- 140 Eddy St
- 85 Farnsworth St
- 18 Los Angeles St
- 32-34 Van Buren Ave
- 827-831 Armory St
- 127 Melha Ave
- 181 Merrimac Ave
- 95 Kingsley St
- 46 Knollwood St
Your Personal Tour Guide
Ask me questions while you tour the home.