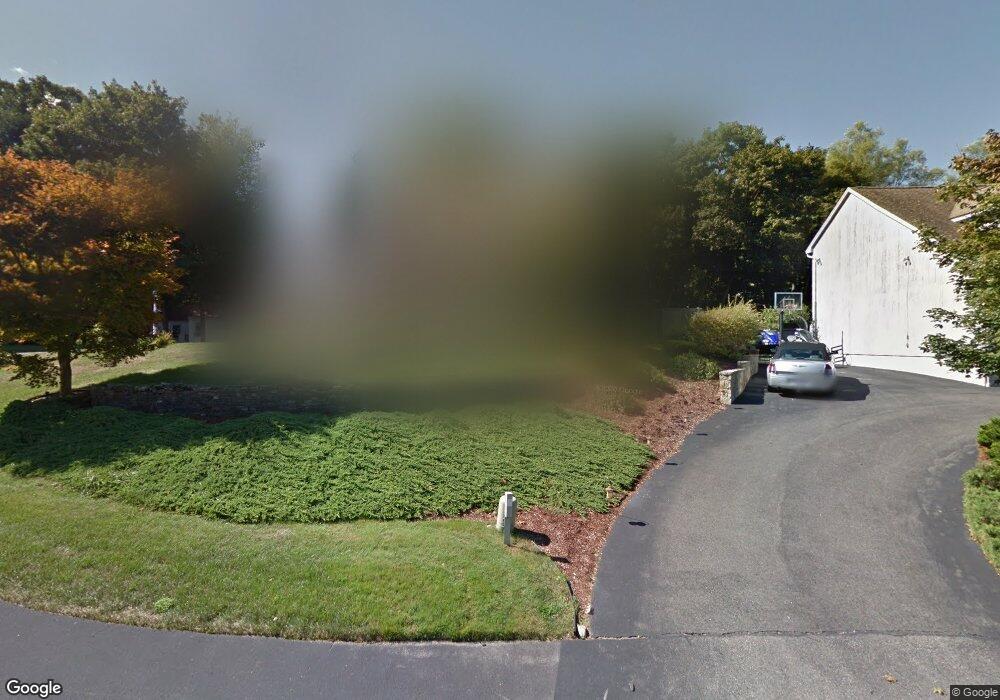
5 Fall Way Lynnfield, MA 01940
Estimated Value: $885,000 - $1,008,661
About This Home
This home is located at 5 Fall Way, Lynnfield, MA 01940 and is currently estimated at $947,165, approximately $279 per square foot. 5 Fall Way is a home located in Essex County with nearby schools including Lynnfield Middle School, Lynnfield High School, and Our Lady Of Assumption School.
Ownership History
We collect this data history from publicly available records. To have your information removed, we recommend requesting removal directly through your county’s website.
Purchase Details
Purchase Details
Home Values in the Area
Average Home Value in this Area
Purchase History
We collect this data history from publicly available records. To have your information removed, we recommend requesting removal directly through your county’s website.
| Date | Buyer | Sale Price | Title Company |
|---|---|---|---|
| -- | -- | ||
| $95,000 | -- |
Mortgage History
We collect this data history from publicly available records. To have your information removed, we recommend requesting removal directly through your county’s website.
| Date | Status | Borrower | Loan Amount |
|---|---|---|---|
| Previous Owner | $75,000 | ||
| Previous Owner | $180,000 | ||
| Previous Owner | $188,000 |
Tax History
We collect this data history from publicly available records. To have your information removed, we recommend requesting removal directly through your county’s website.
| Year | Tax Paid | Tax Assessment Tax Assessment Total Assessment is a certain percentage of the fair market value that is determined by local assessors to be the total taxable value of land and additions on the property. | Land | Improvement |
|---|---|---|---|---|
| 2025 | $10,100 | $956,400 | $486,800 | $469,600 |
| 2024 | $9,399 | $894,300 | $455,000 | $439,300 |
| 2023 | $9,521 | $842,600 | $455,000 | $387,600 |
| 2022 | $9,048 | $754,600 | $420,000 | $334,600 |
| 2021 | $8,836 | $665,900 | $350,000 | $315,900 |
| 2020 | $8,539 | $613,400 | $297,200 | $316,200 |
| 2019 | $7,880 | $566,500 | $250,300 | $316,200 |
| 2018 | $7,795 | $566,500 | $250,300 | $316,200 |
| 2017 | $7,806 | $566,500 | $250,300 | $316,200 |
| 2016 | $7,691 | $530,400 | $236,300 | $294,100 |
| 2015 | $7,670 | $529,300 | $235,200 | $294,100 |
Map
- 17 Munroe St
- 4 Rossmore Rd
- 60r Lynnbrook Rd
- 5 Otter Pond Rd
- 6 Suntaug St
- 922 Lynnfield St
- 741 Salem St
- 900 Lynnfield St Unit 37
- 900 Lynnfield St Unit D16
- 628 Broadway - Aka Ward Terrace
- 37 Maple St
- 344 Broadway
- 1100 Salem St Unit 79
- 1100 Salem St Unit 75
- 47 Brook Dr
- 67 Brook Dr
- 2 Carpenter Rd
- 7 Nells Pond Rd
- 39 Doncaster Cir
- 12 Mansfield St
Ask me questions while you tour the home.