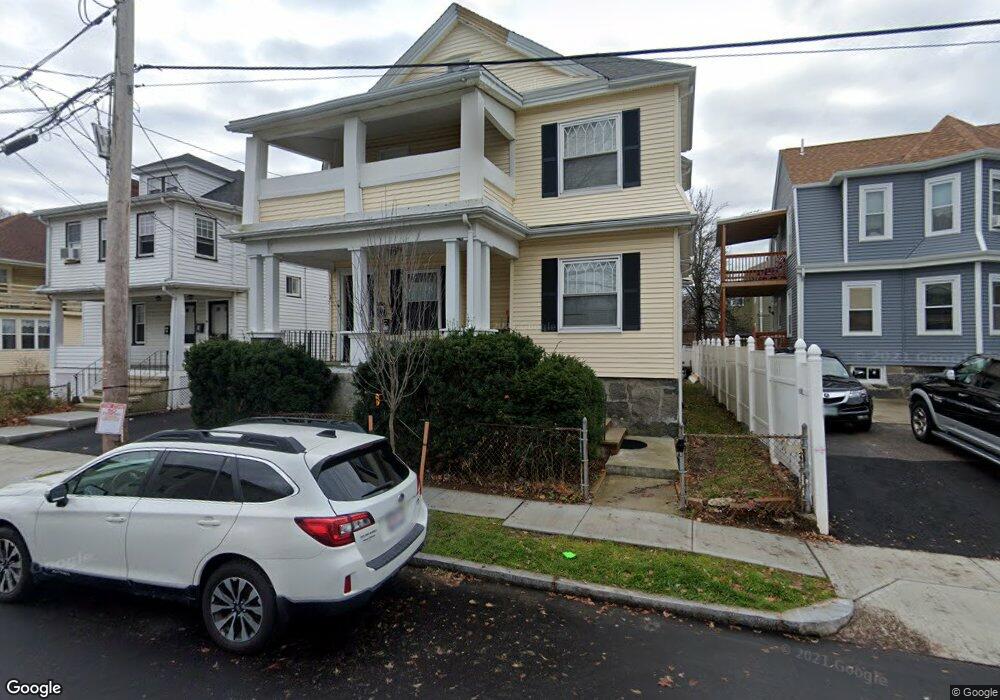
5 Freeman St Quincy, MA 02170
North Quincy NeighborhoodEstimated Value: $897,716 - $1,022,000
5
Beds
2
Baths
2,432
Sq Ft
$395/Sq Ft
Est. Value
About This Home
This home is located at 5 Freeman St, Quincy, MA 02170 and is currently estimated at $961,179, approximately $395 per square foot. 5 Freeman St is a home located in Norfolk County with nearby schools including Francis W. Parker Elementary School, Atlantic Middle School, and North Quincy High School.
Ownership History
Date
Name
Owned For
Owner Type
Purchase Details
Closed on
Sep 1, 2016
Sold by
Wang Meng Q and Ying-Zou Qiu
Bought by
Wang Libin and Wang Meng Q
Current Estimated Value
Purchase Details
Closed on
Sep 24, 2015
Sold by
John R Mctiernan T
Bought by
Wang Meng Q and Zou Qiu Y
Purchase Details
Closed on
Nov 1, 2004
Sold by
Mctiernan Dorothy A
Bought by
John R Mctiernan T and Mctiernan Dorothy A
Home Financials for this Owner
Home Financials are based on the most recent Mortgage that was taken out on this home.
Original Mortgage
$325,000
Interest Rate
5.74%
Mortgage Type
Purchase Money Mortgage
Create a Home Valuation Report for This Property
The Home Valuation Report is an in-depth analysis detailing your home's value as well as a comparison with similar homes in the area
Home Values in the Area
Average Home Value in this Area
Purchase History
We collect this data history from publicly available records. To have your information removed, we recommend requesting removal directly through your county’s website.
| Date | Buyer | Sale Price | Title Company |
|---|---|---|---|
| Wang Libin | -- | -- | |
| Wang Meng Q | $500,000 | -- | |
| John R Mctiernan T | -- | -- |
Source: Public Records
Mortgage History
We collect this data history from publicly available records. To have your information removed, we recommend requesting removal directly through your county’s website.
| Date | Status | Borrower | Loan Amount |
|---|---|---|---|
| Previous Owner | John R Mctiernan T | $325,000 |
Source: Public Records
Tax History
| Year | Tax Paid | Tax Assessment Tax Assessment Total Assessment is a certain percentage of the fair market value that is determined by local assessors to be the total taxable value of land and additions on the property. | Land | Improvement |
|---|---|---|---|---|
| 2025 | $10,024 | $869,400 | $320,200 | $549,200 |
| 2024 | $9,609 | $852,600 | $320,200 | $532,400 |
| 2023 | $9,142 | $821,400 | $291,100 | $530,300 |
| 2022 | $8,779 | $732,800 | $232,900 | $499,900 |
| 2021 | $8,939 | $736,300 | $232,900 | $503,400 |
| 2020 | $8,793 | $707,400 | $228,300 | $479,100 |
| 2019 | $8,416 | $670,600 | $219,500 | $451,100 |
| 2018 | $7,945 | $595,600 | $209,100 | $386,500 |
| 2017 | $7,871 | $555,500 | $190,100 | $365,400 |
| 2016 | $7,006 | $487,900 | $172,800 | $315,100 |
| 2015 | $6,652 | $455,600 | $157,100 | $298,500 |
| 2014 | $5,844 | $393,300 | $157,100 | $236,200 |
Source: Public Records
Map
Nearby Homes
- 46 Warwick St
- 153 Vassall St
- 16 W Squantum St
- 17 Holmes St Unit 101
- 17 Holmes St Unit 1
- 677 Quincy Shore Dr Unit 408
- 45 Holbrook Rd
- 100 W Squantum St Unit 516
- 75 Walker St
- 98 Safford St
- 113 Elm Ave
- 115 W Squantum St Unit 203
- 79 Holbrook Rd Unit 2
- 267-269 Farrington St
- 150 Hancock St Unit 101
- 35 Sewall St
- 60 Montclair Ave
- 851 Quincy Shore Dr
- 175 Quincy Shore Dr Unit B33
- 175 Quincy Shore Dr Unit B66
- 5 Freeman St Unit 1
- 139 Billings Rd
- 9 Freeman St
- 5-7 Freeman St
- 141 Billings Rd
- 133 Billings Rd
- 133 Billings Rd Unit 1/F
- 135 Billings Rd Unit 2/F
- 145 Billings Rd
- 13 Freeman St
- 14 Freeman St
- 12 Tyler St
- 149 Billings Rd
- 12 Freeman St
- 12 Freeman St Unit 3
- 131 Billings Rd
- 17 Freeman St
- 16 Tyler St
- 16 Freeman St
- 155 Billings Rd
Your Personal Tour Guide
Ask me questions while you tour the home.