5 Grandview St Auburn, MA 01501
Stoneville NeighborhoodEstimated Value: $408,063 - $486,000
3
Beds
2
Baths
1,212
Sq Ft
$371/Sq Ft
Est. Value
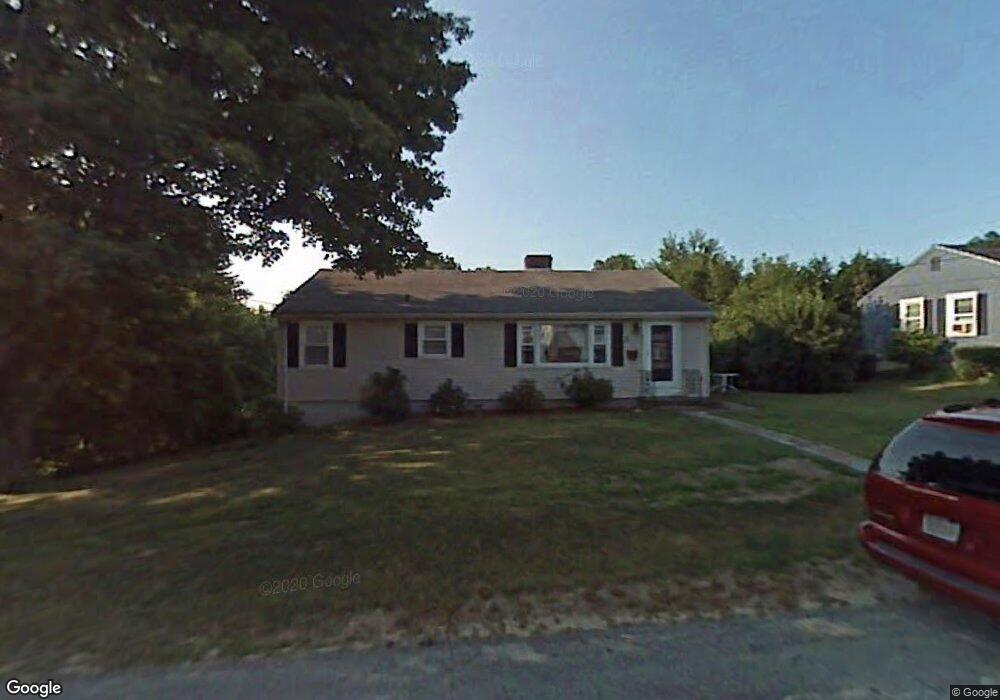
About This Home
This home is located at 5 Grandview St, Auburn, MA 01501 and is currently estimated at $449,266, approximately $370 per square foot. 5 Grandview St is a home located in Worcester County with nearby schools including Auburn Senior High School and Shrewsbury Montessori School - Auburn Campus.
Ownership History
Date
Name
Owned For
Owner Type
Purchase Details
Closed on
Mar 18, 1992
Sold by
Healy Timothy
Bought by
Pierce Karen L and Facteau Robert
Current Estimated Value
Home Financials for this Owner
Home Financials are based on the most recent Mortgage that was taken out on this home.
Original Mortgage
$88,000
Interest Rate
8.62%
Mortgage Type
Purchase Money Mortgage
Create a Home Valuation Report for This Property
The Home Valuation Report is an in-depth analysis detailing your home's value as well as a comparison with similar homes in the area
Home Values in the Area
Average Home Value in this Area
Purchase History
| Date | Buyer | Sale Price | Title Company |
|---|---|---|---|
| Pierce Karen L | $110,000 | -- |
Source: Public Records
Mortgage History
| Date | Status | Borrower | Loan Amount |
|---|---|---|---|
| Open | Pierce Karen L | $95,000 | |
| Closed | Pierce Karen L | $103,000 | |
| Closed | Pierce Karen L | $86,400 | |
| Closed | Pierce Karen L | $88,000 |
Source: Public Records
Tax History
| Year | Tax Paid | Tax Assessment Tax Assessment Total Assessment is a certain percentage of the fair market value that is determined by local assessors to be the total taxable value of land and additions on the property. | Land | Improvement |
|---|---|---|---|---|
| 2025 | $51 | $358,400 | $114,500 | $243,900 |
| 2024 | $5,066 | $339,300 | $108,900 | $230,400 |
| 2023 | $4,878 | $307,200 | $99,000 | $208,200 |
| 2022 | $4,555 | $270,800 | $99,000 | $171,800 |
| 2021 | $4,341 | $239,300 | $87,300 | $152,000 |
| 2020 | $4,304 | $239,400 | $87,300 | $152,100 |
| 2019 | $4,154 | $225,500 | $86,400 | $139,100 |
| 2018 | $9,664 | $212,800 | $80,800 | $132,000 |
| 2017 | $8,994 | $205,300 | $73,300 | $132,000 |
| 2016 | $3,519 | $194,500 | $77,000 | $117,500 |
| 2015 | $3,122 | $180,900 | $77,000 | $103,900 |
| 2014 | $2,957 | $171,000 | $73,300 | $97,700 |
Source: Public Records
Map
Nearby Homes
- 328 Oxford St N
- 36 Central St
- 51 Old Cart Rd
- 8 South Terrace
- 12 Bylund Ave
- 1-9 Helens Way
- 2902 Forest Park Dr Unit 2902
- 25 Vinal St Unit 28
- 25 Vinal St Unit 26
- 14 Goddard Dr
- 19 Oakwood Ave
- 133 Boyce St
- Lot 2 Leicester St
- Lots 2,3,4 Leicester St
- Lot 3 Leicester St
- Lot 4 Leicester St
- 55 Old Common Rd
- 15 Grove St
- 52 Woodland Rd
- 18 Carroll St
Your Personal Tour Guide
Ask me questions while you tour the home.