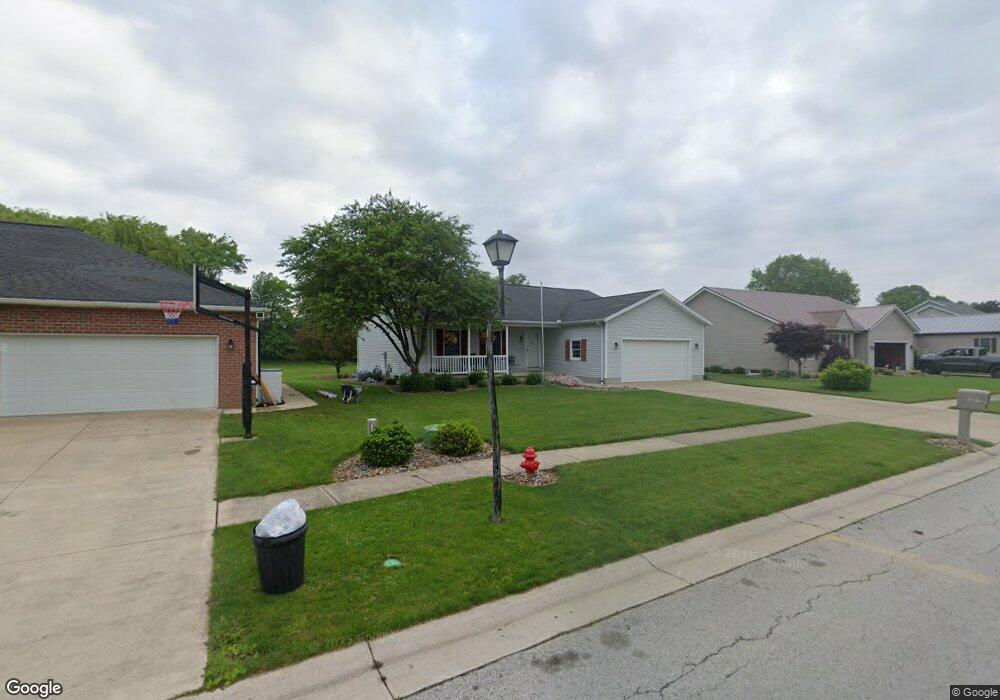
5 Hampton Way Norwalk, OH 44857
Estimated Value: $274,000 - $320,000
About This Home
This home is located at 5 Hampton Way, Norwalk, OH 44857 and is currently estimated at $291,847, approximately $183 per square foot. 5 Hampton Way is a home located in Huron County with nearby schools including Maplehurst Elementary School, Pleasant Elementary School, and League Elementary School.
Ownership History
We collect this data history from publicly available records. To have your information removed, we recommend requesting removal directly through your county’s website.
Purchase Details
Purchase Details
Purchase Details
Purchase Details
Purchase Details
Purchase Details
Purchase Details
Purchase Details
Home Values in the Area
Average Home Value in this Area
Purchase History
We collect this data history from publicly available records. To have your information removed, we recommend requesting removal directly through your county’s website.
| Date | Buyer | Sale Price | Title Company |
|---|---|---|---|
| -- | -- | ||
| -- | -- | ||
| $135,000 | -- | ||
| -- | -- | ||
| $134,900 | -- | ||
| $34,000 | -- | ||
| $66,000 | -- | ||
| -- | -- |
Tax History
We collect this data history from publicly available records. To have your information removed, we recommend requesting removal directly through your county’s website.
| Year | Tax Paid | Tax Assessment Tax Assessment Total Assessment is a certain percentage of the fair market value that is determined by local assessors to be the total taxable value of land and additions on the property. | Land | Improvement |
|---|---|---|---|---|
| 2025 | $3,643 | $88,950 | $11,740 | $77,210 |
| 2024 | $3,643 | $88,950 | $11,740 | $77,210 |
| 2023 | $3,630 | $62,250 | $9,010 | $53,240 |
| 2022 | $2,509 | $62,250 | $9,010 | $53,240 |
| 2021 | $2,510 | $62,250 | $9,010 | $53,240 |
| 2020 | $2,365 | $55,790 | $7,640 | $48,150 |
| 2019 | $2,313 | $55,790 | $7,640 | $48,150 |
| 2018 | $2,272 | $55,790 | $7,640 | $48,150 |
| 2017 | $2,048 | $50,120 | $7,640 | $42,480 |
| 2016 | $2,010 | $50,120 | $7,640 | $42,480 |
| 2015 | $2,009 | $50,130 | $7,650 | $42,480 |
| 2014 | $2,009 | $49,700 | $7,630 | $42,070 |
| 2013 | $1,746 | $49,700 | $7,630 | $42,070 |
Map
- 3 Wedgewood Dr
- 49 Executive Dr
- 1 Jennifer Way
- 431 Old State Rd S
- 52 Breezewood Dr
- 202 Old State Rd S
- 13 High St
- 23 Homewood Ave
- 51 Christie Ave
- 4 Stoutenburg Dr
- 16 Harris Ave
- 67 Harris Ave
- 10 Hawthorne Dr
- 90 S Linwood Ave
- 36 Stoutenburg Dr
- 487 Townline Road 151
- 41 W Elm St
- 43 W Elm St
- 0 Ohio 18 Unit 20260823
- 27 Eagle Creek Dr
Ask me questions while you tour the home.