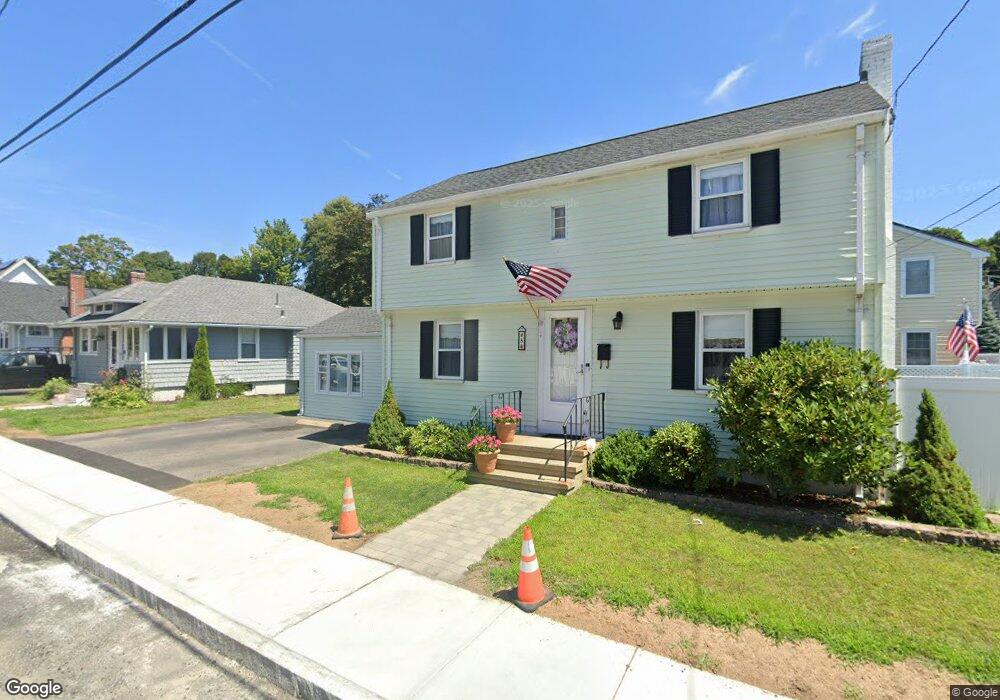
5 Harris St Quincy, MA 02169
South Quincy NeighborhoodEstimated Value: $662,214 - $752,000
3
Beds
1
Bath
1,586
Sq Ft
$436/Sq Ft
Est. Value
About This Home
This home is located at 5 Harris St, Quincy, MA 02169 and is currently estimated at $691,054, approximately $435 per square foot. 5 Harris St is a home located in Norfolk County with nearby schools including South West Middle School, Lincoln-Hancock Community School, and Quincy High School.
Ownership History
Date
Name
Owned For
Owner Type
Purchase Details
Closed on
May 16, 2005
Sold by
Munroe Elvira and Munroe Patrick A
Bought by
Diblasi Lisa M and Diblasi Michael A
Current Estimated Value
Home Financials for this Owner
Home Financials are based on the most recent Mortgage that was taken out on this home.
Original Mortgage
$292,000
Outstanding Balance
$154,299
Interest Rate
6.05%
Mortgage Type
Purchase Money Mortgage
Estimated Equity
$536,755
Create a Home Valuation Report for This Property
The Home Valuation Report is an in-depth analysis detailing your home's value as well as a comparison with similar homes in the area
Home Values in the Area
Average Home Value in this Area
Purchase History
| Date | Buyer | Sale Price | Title Company |
|---|---|---|---|
| Diblasi Lisa M | $365,000 | -- |
Source: Public Records
Mortgage History
| Date | Status | Borrower | Loan Amount |
|---|---|---|---|
| Open | Diblasi Lisa M | $292,000 | |
| Closed | Diblasi Lisa M | $36,500 |
Source: Public Records
Tax History
| Year | Tax Paid | Tax Assessment Tax Assessment Total Assessment is a certain percentage of the fair market value that is determined by local assessors to be the total taxable value of land and additions on the property. | Land | Improvement |
|---|---|---|---|---|
| 2025 | $6,556 | $568,600 | $264,300 | $304,300 |
| 2024 | $6,197 | $549,900 | $251,700 | $298,200 |
| 2023 | $5,877 | $528,000 | $239,700 | $288,300 |
| 2022 | $5,501 | $459,200 | $191,800 | $267,400 |
| 2021 | $5,455 | $449,300 | $191,800 | $257,500 |
| 2020 | $5,321 | $428,100 | $191,800 | $236,300 |
| 2019 | $5,179 | $412,700 | $186,200 | $226,500 |
| 2018 | $5,145 | $385,700 | $172,400 | $213,300 |
| 2017 | $5,066 | $357,500 | $164,200 | $193,300 |
| 2016 | $4,740 | $330,100 | $149,200 | $180,900 |
| 2015 | $4,576 | $313,400 | $140,800 | $172,600 |
| 2014 | $4,455 | $299,800 | $140,800 | $159,000 |
Source: Public Records
Map
Nearby Homes
- 39 Cross St
- 40 Cross St Unit 1
- 283 Copeland St
- 452 Quarry St
- 211 Copeland St
- 38 Jenness St
- 230 Willard St Unit 102
- 230 Willard St Unit 207
- 149 Reservoir Rd
- 84 West St Unit 1
- 580 Quarry St Unit 13
- 510 Willard St
- 312 Adams St
- 21 Arthur St
- 9 Westford St
- 156 West St
- 91 Garfield St
- 132 Centre St
- 211 West St Unit 11B
- 211 West St Unit 12B
- 35 Reardon St
- 11 Harris St
- 1138 Furnace Brook Pkwy
- 29 Reardon St
- 13 Harris St
- 1144 Furnace Brook Pkwy
- 1146 Furnace Brook Pkwy
- 1132 Furnace Brook Pkwy
- 36 Reardon St
- 10 Barry St
- 12 Harris St
- 4 Barry St
- 1150 Furnace Brook Pkwy
- 15 Harris St
- 17 Harris St
- 14 Barry St
- 28 Reardon St
- 20 Harris St
- 18 Barry St
- 26 Reardon St
Your Personal Tour Guide
Ask me questions while you tour the home.