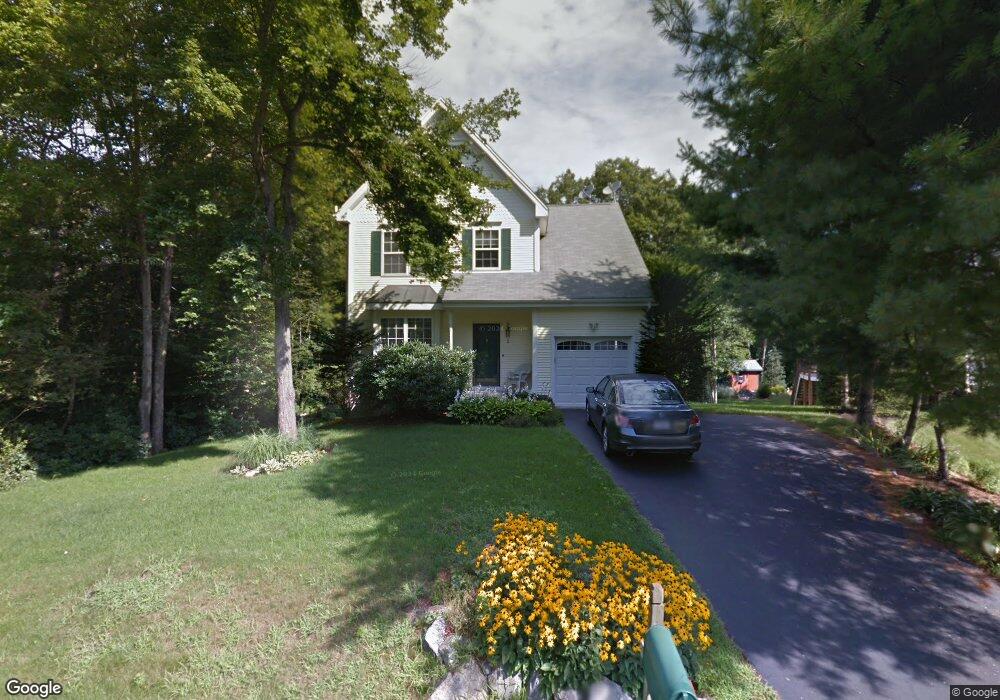
5 Howe Ln Foxboro, MA 02035
Estimated Value: $670,000 - $798,000
About This Home
This home is located at 5 Howe Ln, Foxboro, MA 02035 and is currently estimated at $724,828, approximately $398 per square foot. 5 Howe Ln is a home located in Norfolk County with nearby schools including Foxborough High School, Foxborough Regional Charter School, and The Sage School.
Ownership History
We collect this data history from publicly available records. To have your information removed, we recommend requesting removal directly through your county’s website.
Purchase Details
Purchase Details
Purchase Details
Purchase Details
Home Values in the Area
Average Home Value in this Area
Purchase History
We collect this data history from publicly available records. To have your information removed, we recommend requesting removal directly through your county’s website.
| Date | Buyer | Sale Price | Title Company |
|---|---|---|---|
| $390,000 | -- | ||
| $417,500 | -- | ||
| $287,450 | -- | ||
| $178,109 | -- |
Mortgage History
We collect this data history from publicly available records. To have your information removed, we recommend requesting removal directly through your county’s website.
| Date | Status | Borrower | Loan Amount |
|---|---|---|---|
| Open | $291,500 | ||
| Closed | $292,800 | ||
| Closed | $304,000 |
Tax History
We collect this data history from publicly available records. To have your information removed, we recommend requesting removal directly through your county’s website.
| Year | Tax Paid | Tax Assessment Tax Assessment Total Assessment is a certain percentage of the fair market value that is determined by local assessors to be the total taxable value of land and additions on the property. | Land | Improvement |
|---|---|---|---|---|
| 2025 | $7,489 | $566,500 | $221,600 | $344,900 |
| 2024 | $7,386 | $546,700 | $225,600 | $321,100 |
| 2023 | $7,102 | $499,800 | $214,900 | $284,900 |
| 2022 | $6,624 | $456,200 | $180,200 | $276,000 |
| 2021 | $6,465 | $438,600 | $166,900 | $271,700 |
| 2020 | $6,264 | $429,900 | $166,900 | $263,000 |
| 2019 | $5,946 | $404,500 | $158,900 | $245,600 |
| 2018 | $5,796 | $397,800 | $158,900 | $238,900 |
| 2017 | $5,598 | $372,200 | $148,500 | $223,700 |
| 2016 | $5,606 | $378,300 | $149,700 | $228,600 |
| 2015 | $5,564 | $366,300 | $126,600 | $239,700 |
| 2014 | $5,300 | $353,600 | $118,300 | $235,300 |
Map
- 9 Grover Ln
- 15 Nason Ln
- 160 East St
- 11 Black Elk Rd
- Lot One Old Wolomolopoag St
- Lot Two Old Wolomolopoag St
- 4 Solstice Way
- 68 Alden St
- 12 Iron Hollow Rd
- 15 Boyden Dr
- 5 Kinsman Way
- 13 Brookside Dr
- 11 Cow Hill Rd
- 52 Morse St
- 31 Atherton Rd
- 19 Windsor Dr
- 54 Barefoot Hill Rd
- 19 Carter Rd
- 15 Wadsworth Way
- 8 Windsor Dr
Ask me questions while you tour the home.