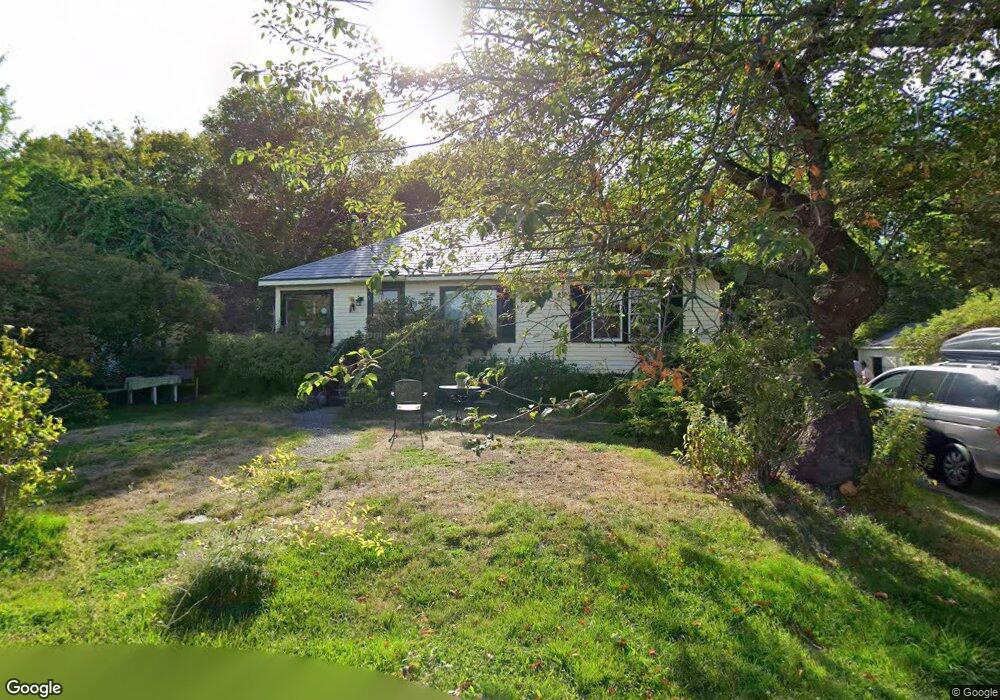
5 Irvana Rd Rockport, MA 01966
Estimated Value: $708,710 - $859,000
3
Beds
2
Baths
1,040
Sq Ft
$767/Sq Ft
Est. Value
About This Home
This home is located at 5 Irvana Rd, Rockport, MA 01966 and is currently estimated at $797,178, approximately $766 per square foot. 5 Irvana Rd is a home located in Essex County with nearby schools including Rockport Elementary School, Rockport Middle School, and Rockport High School.
Ownership History
Date
Name
Owned For
Owner Type
Purchase Details
Closed on
Mar 13, 1995
Sold by
Rosenbloom Leon Est and Rosenberg
Bought by
Bradford Robert and Bradford Kathryn
Current Estimated Value
Home Financials for this Owner
Home Financials are based on the most recent Mortgage that was taken out on this home.
Original Mortgage
$142,500
Interest Rate
9.09%
Mortgage Type
Purchase Money Mortgage
Create a Home Valuation Report for This Property
The Home Valuation Report is an in-depth analysis detailing your home's value as well as a comparison with similar homes in the area
Home Values in the Area
Average Home Value in this Area
Purchase History
We collect this data history from publicly available records. To have your information removed, we recommend requesting removal directly through your county’s website.
| Date | Buyer | Sale Price | Title Company |
|---|---|---|---|
| Bradford Robert | $150,000 | -- | |
| Bradford Robert | $150,000 | -- |
Source: Public Records
Mortgage History
We collect this data history from publicly available records. To have your information removed, we recommend requesting removal directly through your county’s website.
| Date | Status | Borrower | Loan Amount |
|---|---|---|---|
| Closed | Bradford Robert | $100,000 | |
| Closed | Bradford Robert | $115,000 | |
| Closed | Bradford Robert | $141,400 | |
| Closed | Bradford Robert | $142,500 |
Source: Public Records
Tax History
| Year | Tax Paid | Tax Assessment Tax Assessment Total Assessment is a certain percentage of the fair market value that is determined by local assessors to be the total taxable value of land and additions on the property. | Land | Improvement |
|---|---|---|---|---|
| 2025 | $5,931 | $677,000 | $443,200 | $233,800 |
| 2024 | $5,486 | $651,600 | $433,100 | $218,500 |
| 2023 | $5,316 | $563,700 | $362,600 | $201,100 |
| 2022 | $5,367 | $546,500 | $336,900 | $209,600 |
| 2021 | $5,072 | $520,700 | $320,800 | $199,900 |
| 2020 | $4,228 | $418,600 | $305,500 | $113,100 |
| 2019 | $3,867 | $392,200 | $297,700 | $94,500 |
| 2018 | $3,733 | $369,200 | $277,800 | $91,400 |
| 2017 | $3,774 | $334,600 | $252,000 | $82,600 |
| 2016 | $3,836 | $341,000 | $253,600 | $87,400 |
| 2015 | $3,610 | $328,200 | $244,900 | $83,300 |
| 2014 | $3,470 | $307,900 | $227,400 | $80,500 |
Source: Public Records
Map
Nearby Homes
- 48 Eden Rd
- 68 Eden Rd
- 19 Old Garden Rd
- 8 Marbee Rd
- 34 Mount Pleasant St
- 8 Hideaway Place
- 33 Highview Rd
- 2 Mount Pleasant St Unit 3
- 2 Mount Pleasant St Unit 4
- 1 High St
- 15 High St Unit D
- 38 & 38R High St
- 6 Parker St
- 24 High St Unit 1
- 24 High St
- 64 High St
- 4 Middle Rd
- 4 Toomey Ln
- 20 Main St Unit 11
- 15 Beach St
Your Personal Tour Guide
Ask me questions while you tour the home.