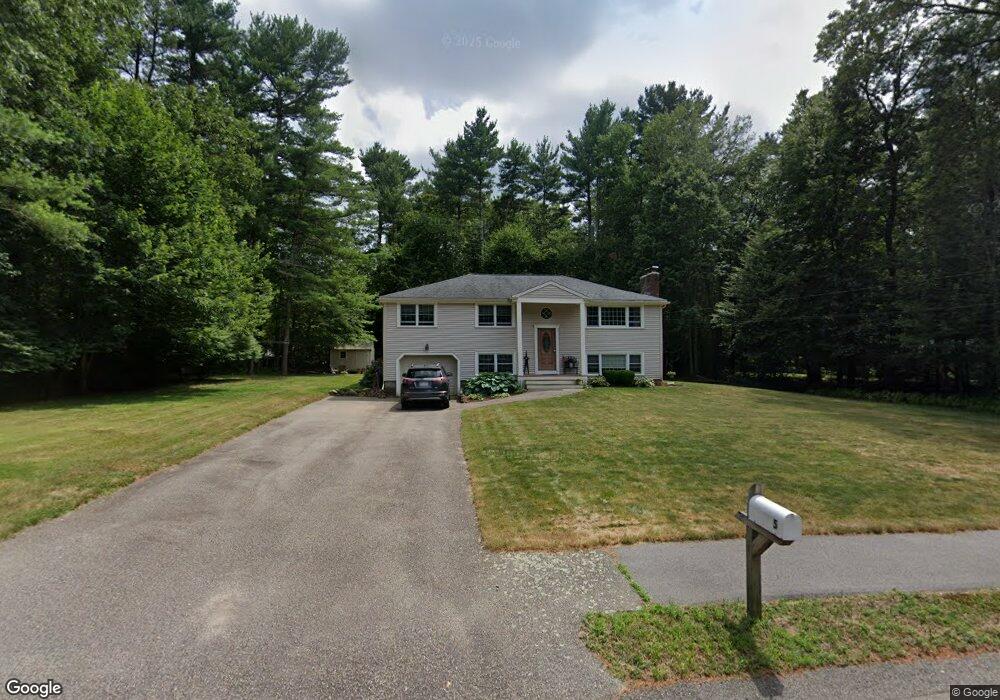
5 Lafayette Ln Norfolk, MA 02056
Estimated Value: $521,000 - $662,000
3
Beds
1
Bath
1,188
Sq Ft
$495/Sq Ft
Est. Value
About This Home
This home is located at 5 Lafayette Ln, Norfolk, MA 02056 and is currently estimated at $587,835, approximately $494 per square foot. 5 Lafayette Ln is a home located in Norfolk County with nearby schools including H. Olive Day School, Freeman-Kennedy School, and Foxborough Regional Charter School.
Ownership History
Date
Name
Owned For
Owner Type
Purchase Details
Closed on
Sep 13, 1989
Sold by
Holt Simone M
Bought by
Conley Arthur T
Current Estimated Value
Home Financials for this Owner
Home Financials are based on the most recent Mortgage that was taken out on this home.
Original Mortgage
$95,000
Interest Rate
9.58%
Mortgage Type
Purchase Money Mortgage
Create a Home Valuation Report for This Property
The Home Valuation Report is an in-depth analysis detailing your home's value as well as a comparison with similar homes in the area
Home Values in the Area
Average Home Value in this Area
Purchase History
| Date | Buyer | Sale Price | Title Company |
|---|---|---|---|
| Conley Arthur T | $100,000 | -- |
Source: Public Records
Mortgage History
| Date | Status | Borrower | Loan Amount |
|---|---|---|---|
| Open | Conley Arthur T | $30,000 | |
| Closed | Conley Arthur T | $98,000 | |
| Closed | Conley Arthur T | $95,000 |
Source: Public Records
Tax History
| Year | Tax Paid | Tax Assessment Tax Assessment Total Assessment is a certain percentage of the fair market value that is determined by local assessors to be the total taxable value of land and additions on the property. | Land | Improvement |
|---|---|---|---|---|
| 2025 | $8,271 | $517,900 | $214,600 | $303,300 |
| 2024 | $7,537 | $484,100 | $214,600 | $269,500 |
| 2023 | $7,457 | $454,400 | $214,600 | $239,800 |
| 2022 | $7,690 | $422,500 | $201,200 | $221,300 |
| 2021 | $7,191 | $399,700 | $195,300 | $204,400 |
| 2020 | $6,498 | $348,600 | $177,400 | $171,200 |
| 2019 | $6,140 | $335,700 | $177,400 | $158,300 |
| 2018 | $5,817 | $312,400 | $177,400 | $135,000 |
| 2017 | $5,732 | $314,600 | $177,400 | $137,200 |
| 2016 | $5,267 | $291,300 | $177,400 | $113,900 |
| 2015 | $5,068 | $287,000 | $169,000 | $118,000 |
| 2014 | $5,034 | $288,800 | $169,000 | $119,800 |
Source: Public Records
Map
Nearby Homes
- 7 Hill St Unit 12
- 7 Hill St Unit 16
- 25 Foxboro Rd
- 131 Washington St Unit 32
- 131 Washington St Unit 50
- 9 Sharon Ave
- 11 Sharon Ave
- 8 Conway Ln
- 12 Goodwin Dr
- 576 Dedham St
- 12 Patriot Dr
- 30 Weber Farm Rd Unit 30
- 1 Weber Farm Rd Unit 1
- 8 Weber Farm Rd Unit 8
- 6 Weber Farm Rd Unit 6
- 4 Weber Farm Rd Unit 4
- 11 Weber Farm Rd Unit 11
- 260 Summer St
- 6 Alger Rd
- 6 Cross St
Your Personal Tour Guide
Ask me questions while you tour the home.