Estimated Value: $626,500 - $994,000
2
Beds
2
Baths
831
Sq Ft
$879/Sq Ft
Est. Value
About This Home
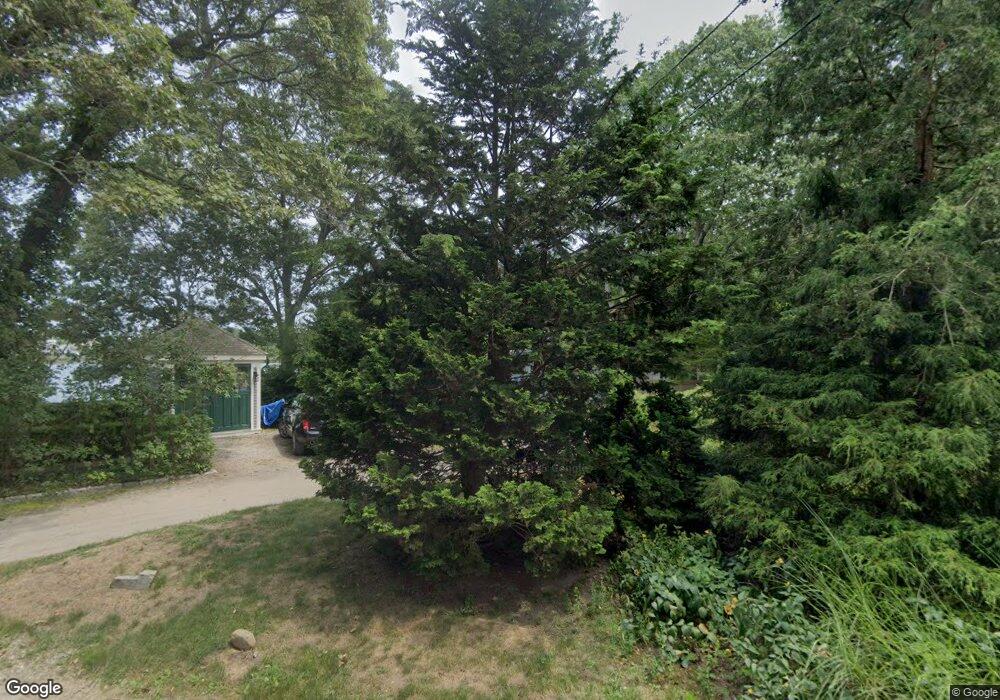
This home is located at 5 Loop Dr, North Kingstown, RI 02852 and is currently estimated at $730,625, approximately $879 per square foot. 5 Loop Dr is a home located in Washington County with nearby schools including Fishing Cove Elementary School, Wickford Middle School, and North Kingstown Sr. High School.
Ownership History
Date
Name
Owned For
Owner Type
Purchase Details
Closed on
Dec 26, 1995
Sold by
Thompson Linda G
Bought by
Wright Helen M
Current Estimated Value
Create a Home Valuation Report for This Property
The Home Valuation Report is an in-depth analysis detailing your home's value as well as a comparison with similar homes in the area
Home Values in the Area
Average Home Value in this Area
Purchase History
We collect this data history from publicly available records. To have your information removed, we recommend requesting removal directly through your county’s website.
| Date | Buyer | Sale Price | Title Company |
|---|---|---|---|
| Wright Helen M | $110,000 | -- |
Source: Public Records
Mortgage History
We collect this data history from publicly available records. To have your information removed, we recommend requesting removal directly through your county’s website.
| Date | Status | Borrower | Loan Amount |
|---|---|---|---|
| Open | Wright Helen M | $350,000 | |
| Closed | Wright Helen M | $320,000 | |
| Closed | Wright Helen M | $71,783 | |
| Closed | Wright Helen M | $136,800 |
Source: Public Records
Tax History
| Year | Tax Paid | Tax Assessment Tax Assessment Total Assessment is a certain percentage of the fair market value that is determined by local assessors to be the total taxable value of land and additions on the property. | Land | Improvement |
|---|---|---|---|---|
| 2025 | $6,146 | $556,700 | $472,800 | $83,900 |
| 2024 | $6,918 | $482,400 | $409,000 | $73,400 |
| 2023 | $6,918 | $482,400 | $409,000 | $73,400 |
| 2022 | $6,783 | $482,400 | $409,000 | $73,400 |
| 2021 | $5,516 | $315,200 | $265,900 | $49,300 |
| 2020 | $5,387 | $315,200 | $265,900 | $49,300 |
| 2019 | $5,387 | $315,200 | $265,900 | $49,300 |
| 2018 | $5,979 | $315,200 | $265,900 | $49,300 |
| 2017 | $5,860 | $315,200 | $265,900 | $49,300 |
| 2016 | $5,693 | $315,200 | $265,900 | $49,300 |
| 2015 | $5,780 | $299,500 | $250,200 | $49,300 |
| 2014 | $5,664 | $299,500 | $250,200 | $49,300 |
Source: Public Records
Map
Nearby Homes
- 70 Lindley Ave
- 95 W Main St
- 195 Fairway Dr
- 54 Thelma Irene Dr
- 11 Elm Dr
- 110 Ten Rod Rd
- 281 Wickford Ct Unit 23
- 32 Ocean Ave
- 159 Ten Rod Rd
- 41 Enfield Ave
- 510 Boston Neck Rd
- 817 Tower Hill Rd
- 26 Bowline Dr
- 8005 Post Rd
- 40 Web Ave Unit 217
- 11 Johnson Ave
- 110 Sea View Ave
- 41 Buena Vista Dr
- 255 Seabreeze Dr
- 90 Sweetmeadow Dr
Your Personal Tour Guide
Ask me questions while you tour the home.