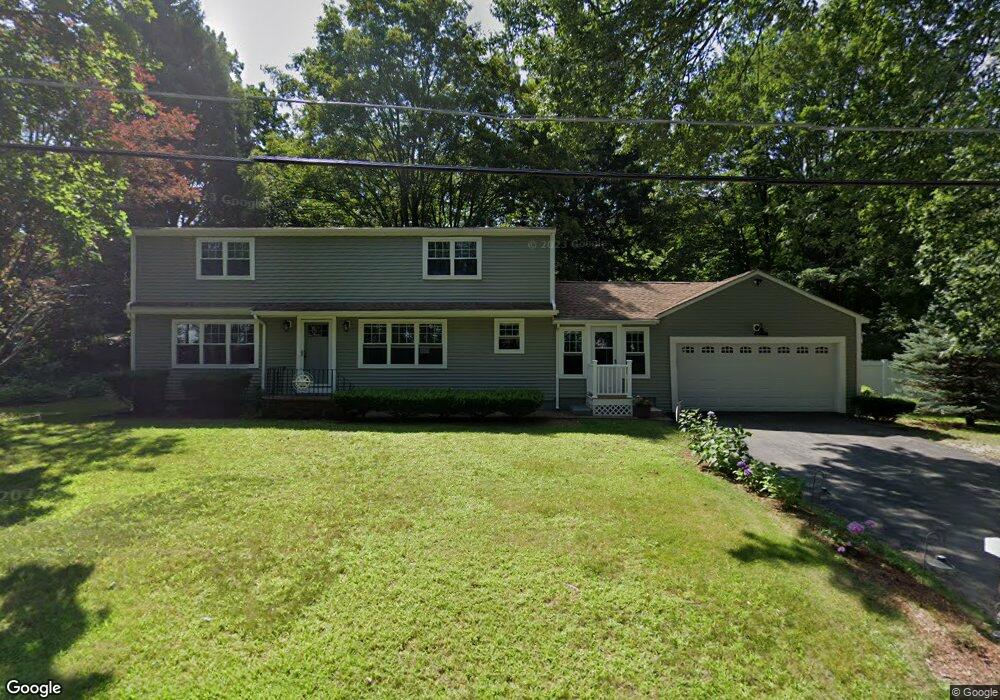
5 Lynn St Woburn, MA 01801
Walnut Hill NeighborhoodEstimated Value: $675,000 - $1,082,000
3
Beds
1
Bath
1,559
Sq Ft
$575/Sq Ft
Est. Value
About This Home
This home is located at 5 Lynn St, Woburn, MA 01801 and is currently estimated at $896,358, approximately $574 per square foot. 5 Lynn St is a home located in Middlesex County with nearby schools including Stoneham High School and St. Patrick Elementary School.
Ownership History
Date
Name
Owned For
Owner Type
Purchase Details
Closed on
Mar 4, 2022
Sold by
Gianino Danielle M and Gianino Nathan D
Bought by
5 Lynn Street Nt and Gianino
Current Estimated Value
Purchase Details
Closed on
May 12, 2017
Sold by
Gianino Danielle M
Bought by
Keeley Danielle M and Gianino Nathan D
Home Financials for this Owner
Home Financials are based on the most recent Mortgage that was taken out on this home.
Original Mortgage
$335,000
Interest Rate
4.14%
Mortgage Type
New Conventional
Purchase Details
Closed on
Oct 30, 2009
Sold by
Cormier Richard L and Cormier Cynthia J
Bought by
Keeley Danielle M
Create a Home Valuation Report for This Property
The Home Valuation Report is an in-depth analysis detailing your home's value as well as a comparison with similar homes in the area
Home Values in the Area
Average Home Value in this Area
Purchase History
| Date | Buyer | Sale Price | Title Company |
|---|---|---|---|
| 5 Lynn Street Nt | -- | None Available | |
| 5 Lynn Street Nt | -- | None Available | |
| Keeley Danielle M | -- | -- | |
| Keeley Danielle M | -- | -- | |
| Keeley Danielle M | -- | -- | |
| Keeley Danielle M | $284,900 | -- | |
| Keeley Danielle M | $284,900 | -- |
Source: Public Records
Mortgage History
| Date | Status | Borrower | Loan Amount |
|---|---|---|---|
| Previous Owner | Keeley Danielle M | $335,000 |
Source: Public Records
Tax History
| Year | Tax Paid | Tax Assessment Tax Assessment Total Assessment is a certain percentage of the fair market value that is determined by local assessors to be the total taxable value of land and additions on the property. | Land | Improvement |
|---|---|---|---|---|
| 2025 | $6,746 | $789,900 | $342,900 | $447,000 |
| 2024 | $5,989 | $743,000 | $326,900 | $416,100 |
| 2023 | $6,046 | $694,900 | $297,300 | $397,600 |
| 2022 | $5,829 | $624,100 | $259,500 | $364,600 |
| 2021 | $5,326 | $570,900 | $247,500 | $323,400 |
| 2020 | $5,302 | $568,900 | $247,500 | $321,400 |
| 2019 | $5,253 | $552,900 | $236,100 | $316,800 |
| 2018 | $4,999 | $505,500 | $217,200 | $288,300 |
| 2017 | $4,548 | $457,500 | $207,300 | $250,200 |
| 2016 | $3,472 | $345,500 | $194,200 | $151,300 |
| 2015 | $3,338 | $328,200 | $182,000 | $146,200 |
| 2014 | $3,187 | $305,300 | $182,000 | $123,300 |
Source: Public Records
Map
Nearby Homes
- 16 Felton St
- 18 Montvale Rd
- 10 Rodgers Rd
- 4 Magnolia Terrace
- 23 Sunrise Ave
- 18 Central St
- 84 Curtis St
- 100 Ledgewood Dr Unit 410
- 159 Main St Unit 27C
- 159 Main St Unit 39A
- 7 Augustus Ct Unit 1013
- 349 South St
- 133 Pine Ridge Rd
- 6 Stratton Dr Unit 3303
- 6 Stratton Dr Unit 208
- 6 Stratton Dr Unit 3307
- 313 South St
- 68 Main St Unit 21C
- 12 Isola Ln
- 66 Main St Unit 47A
Your Personal Tour Guide
Ask me questions while you tour the home.