5 Mars Ct Durham, NC 27703
Eastern Durham NeighborhoodEstimated Value: $384,000 - $457,554
About This Home
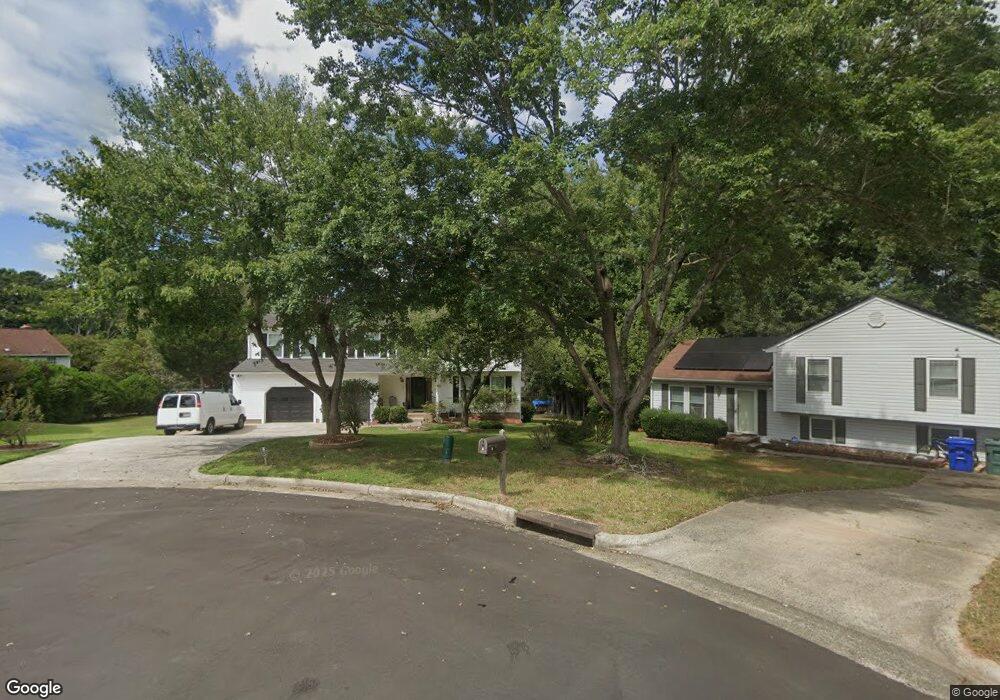
This home is located at 5 Mars Ct, Durham, NC 27703 and is currently estimated at $417,389, approximately $159 per square foot. 5 Mars Ct is a home located in Durham County with nearby schools including Merrick-Moore Elementary School, John W Neal Middle School, and Southern School of Energy & Sustainability.
Ownership History
We collect this data history from publicly available records. To have your information removed, we recommend requesting removal directly through your county’s website.
Purchase Details
Home Financials for this Owner
Home Financials are based on the most recent Mortgage that was taken out on this home.Purchase Details
Home Financials for this Owner
Home Financials are based on the most recent Mortgage that was taken out on this home.Home Values in the Area
Average Home Value in this Area
Purchase History
We collect this data history from publicly available records. To have your information removed, we recommend requesting removal directly through your county’s website.
| Date | Buyer | Sale Price | Title Company |
|---|---|---|---|
| $142,000 | -- | ||
| $141,000 | -- |
Mortgage History
We collect this data history from publicly available records. To have your information removed, we recommend requesting removal directly through your county’s website.
| Date | Status | Borrower | Loan Amount |
|---|---|---|---|
| Open | $85,000 | ||
| Closed | $28,000 | ||
| Closed | $15,000 | ||
| Closed | $141,923 | ||
| Previous Owner | $144,998 |
Tax History
We collect this data history from publicly available records. To have your information removed, we recommend requesting removal directly through your county’s website.
| Year | Tax Paid | Tax Assessment Tax Assessment Total Assessment is a certain percentage of the fair market value that is determined by local assessors to be the total taxable value of land and additions on the property. | Land | Improvement |
|---|---|---|---|---|
| 2025 | $2,427 | $408,008 | $89,050 | $318,958 |
| 2024 | $2,072 | $247,585 | $27,460 | $220,125 |
| 2023 | $3,243 | $247,585 | $27,460 | $220,125 |
| 2022 | $3,169 | $247,585 | $27,460 | $220,125 |
| 2021 | $3,154 | $247,585 | $27,460 | $220,125 |
| 2020 | $3,080 | $247,585 | $27,460 | $220,125 |
| 2019 | $3,080 | $247,585 | $27,460 | $220,125 |
| 2018 | $2,701 | $199,148 | $27,460 | $171,688 |
| 2017 | $2,682 | $199,148 | $27,460 | $171,688 |
| 2016 | $2,591 | $199,148 | $27,460 | $171,688 |
| 2015 | $2,907 | $210,032 | $28,842 | $181,190 |
| 2014 | $2,907 | $210,032 | $28,842 | $181,190 |
Map
- 3413 Kerrigan Ct
- 7 Mercury Ct
- 607 Chandler Rd
- 631-633 Clayton Rd
- 3504 Penn Dr
- 822 Clayton Rd
- 217 Fountain St
- 209 Fountain St
- 912 Obsidian Way
- 620 Hurley Rd
- 3514 Thornwood Dr
- 741 Obsidian Way
- 3019 Ross Rd
- 3613 Turquoise Dr
- 719 Obsidian Way
- 3708 Thornwood Dr
- 1440 Hatteras Rd
- 1438 Hatteras Rd
- 507 Lodestone Dr
- 1436 Hatteras Rd
Ask me questions while you tour the home.