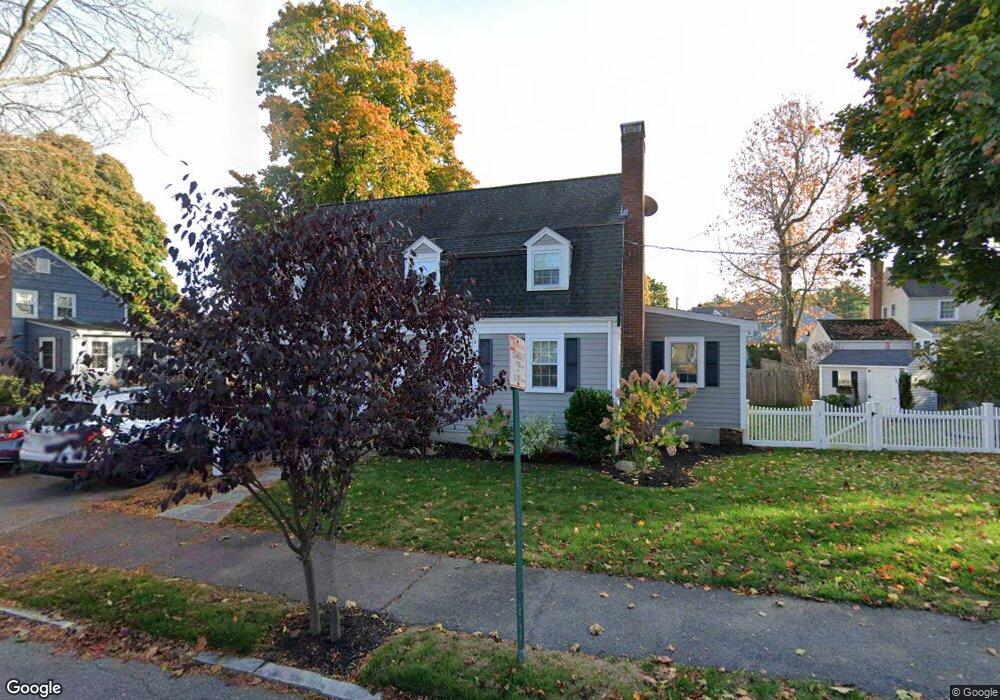
5 Morel Cir Wakefield, MA 01880
Greenwood NeighborhoodEstimated Value: $773,000 - $825,000
About This Home
This home is located at 5 Morel Cir, Wakefield, MA 01880 and is currently estimated at $804,738, approximately $508 per square foot. 5 Morel Cir is a home located in Middlesex County with nearby schools including Wakefield Memorial High School, Melrose Montessori School, and St Mary's School.
Ownership History
We collect this data history from publicly available records. To have your information removed, we recommend requesting removal directly through your county’s website.
Purchase Details
Home Values in the Area
Average Home Value in this Area
Purchase History
We collect this data history from publicly available records. To have your information removed, we recommend requesting removal directly through your county’s website.
| Date | Buyer | Sale Price | Title Company |
|---|---|---|---|
| $269,000 | -- |
Mortgage History
We collect this data history from publicly available records. To have your information removed, we recommend requesting removal directly through your county’s website.
| Date | Status | Borrower | Loan Amount |
|---|---|---|---|
| Open | $250,000 | ||
| Closed | $300,000 | ||
| Closed | $210,500 | ||
| Closed | $227,000 | ||
| Closed | $227,000 |
Tax History
We collect this data history from publicly available records. To have your information removed, we recommend requesting removal directly through your county’s website.
| Year | Tax Paid | Tax Assessment Tax Assessment Total Assessment is a certain percentage of the fair market value that is determined by local assessors to be the total taxable value of land and additions on the property. | Land | Improvement |
|---|---|---|---|---|
| 2025 | $7,748 | $682,600 | $384,700 | $297,900 |
| 2024 | $7,143 | $634,900 | $357,800 | $277,100 |
| 2023 | $6,952 | $592,700 | $334,000 | $258,700 |
| 2022 | $6,520 | $529,200 | $298,200 | $231,000 |
| 2021 | $6,273 | $492,800 | $272,600 | $220,200 |
| 2020 | $5,900 | $462,000 | $255,600 | $206,400 |
| 2019 | $5,534 | $431,300 | $238,600 | $192,700 |
| 2018 | $5,333 | $411,800 | $227,900 | $183,900 |
| 2017 | $5,015 | $384,900 | $213,000 | $171,900 |
| 2016 | $5,041 | $373,700 | $210,300 | $163,400 |
| 2015 | $4,706 | $349,100 | $196,500 | $152,600 |
| 2014 | $4,353 | $340,600 | $191,700 | $148,900 |
Map
- 1068 Main St
- 34 Greenwood Ave
- 6 Findlay St
- 3 Myrtle Terrace
- 991 Main St
- 16 Ells Ave
- 25 Ledge St
- 9 Ledge St
- 95 Greenwood Ave
- 56 Nowell Rd
- 24 Mount Zion Rd
- 22 Mount Zion Rd
- 19 Belmont Rd
- 69 Meriam St
- 3 Fellsmere Ave
- 73 Sweetwater St
- 12 Lovis Ave
- 25 Fellsmere Ave
- 601 Franklin St Unit 2
- 585 Franklin St Unit 6
Ask me questions while you tour the home.