5 Morse Cir Northborough, MA 01532
Estimated Value: $772,721 - $837,000
4
Beds
3
Baths
2,236
Sq Ft
$362/Sq Ft
Est. Value
About This Home
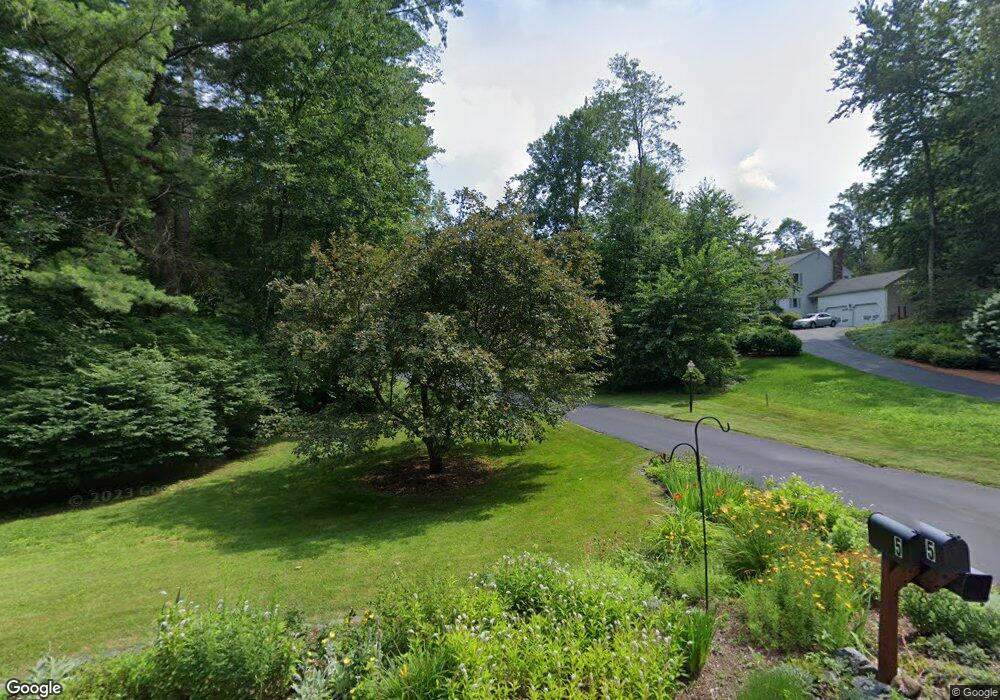
This home is located at 5 Morse Cir, Northborough, MA 01532 and is currently estimated at $809,930, approximately $362 per square foot. 5 Morse Cir is a home located in Worcester County with nearby schools including Marion E. Zeh Elementary School, Robert E. Melican Middle School, and Algonquin Regional High School.
Ownership History
Date
Name
Owned For
Owner Type
Purchase Details
Closed on
Feb 4, 2026
Sold by
Wrean Mariel and Wrean Sarah B
Bought by
Wrean Ft and Wrean
Current Estimated Value
Purchase Details
Closed on
Feb 5, 2024
Sold by
Wrean Sarah and Wrean Mariel K
Bought by
Wrean Mariel and Wrean Sarah B
Purchase Details
Closed on
Mar 25, 2023
Sold by
Wrean Sarah and Wrean Mariel K
Bought by
Wrean Sarah and Wrean Mariel K
Purchase Details
Closed on
May 20, 2022
Sold by
Webster William and Webster Mary E
Bought by
Wrean Sarah and Wrean Mariel K
Home Financials for this Owner
Home Financials are based on the most recent Mortgage that was taken out on this home.
Original Mortgage
$538,125
Interest Rate
4.72%
Mortgage Type
Purchase Money Mortgage
Purchase Details
Closed on
Jun 24, 2013
Sold by
Webster Mary
Bought by
Webster William and Webster Mary E
Create a Home Valuation Report for This Property
The Home Valuation Report is an in-depth analysis detailing your home's value as well as a comparison with similar homes in the area
Home Values in the Area
Average Home Value in this Area
Purchase History
We collect this data history from publicly available records. To have your information removed, we recommend requesting removal directly through your county’s website.
| Date | Buyer | Sale Price | Title Company |
|---|---|---|---|
| Wrean Ft | -- | -- | |
| Wrean Mariel | -- | None Available | |
| Wrean Sarah | -- | None Available | |
| Wrean Sarah | $717,500 | None Available | |
| Webster William | -- | -- | |
| Webster William S | -- | -- |
Source: Public Records
Mortgage History
We collect this data history from publicly available records. To have your information removed, we recommend requesting removal directly through your county’s website.
| Date | Status | Borrower | Loan Amount |
|---|---|---|---|
| Previous Owner | Wrean Sarah | $538,125 |
Source: Public Records
Tax History
| Year | Tax Paid | Tax Assessment Tax Assessment Total Assessment is a certain percentage of the fair market value that is determined by local assessors to be the total taxable value of land and additions on the property. | Land | Improvement |
|---|---|---|---|---|
| 2025 | $9,895 | $694,400 | $315,500 | $378,900 |
| 2024 | $8,785 | $615,200 | $251,800 | $363,400 |
| 2023 | $8,164 | $552,000 | $237,400 | $314,600 |
| 2022 | $7,904 | $479,300 | $226,200 | $253,100 |
| 2021 | $7,601 | $444,000 | $205,800 | $238,200 |
| 2020 | $7,552 | $437,800 | $194,200 | $243,600 |
| 2019 | $7,333 | $427,600 | $188,600 | $239,000 |
| 2018 | $6,493 | $373,400 | $183,800 | $189,600 |
| 2017 | $6,332 | $364,100 | $183,800 | $180,300 |
| 2016 | $6,190 | $360,500 | $180,200 | $180,300 |
| 2015 | $6,209 | $371,100 | $191,100 | $180,000 |
| 2014 | $6,095 | $367,400 | $191,100 | $176,300 |
Source: Public Records
Map
Nearby Homes
Your Personal Tour Guide
Ask me questions while you tour the home.