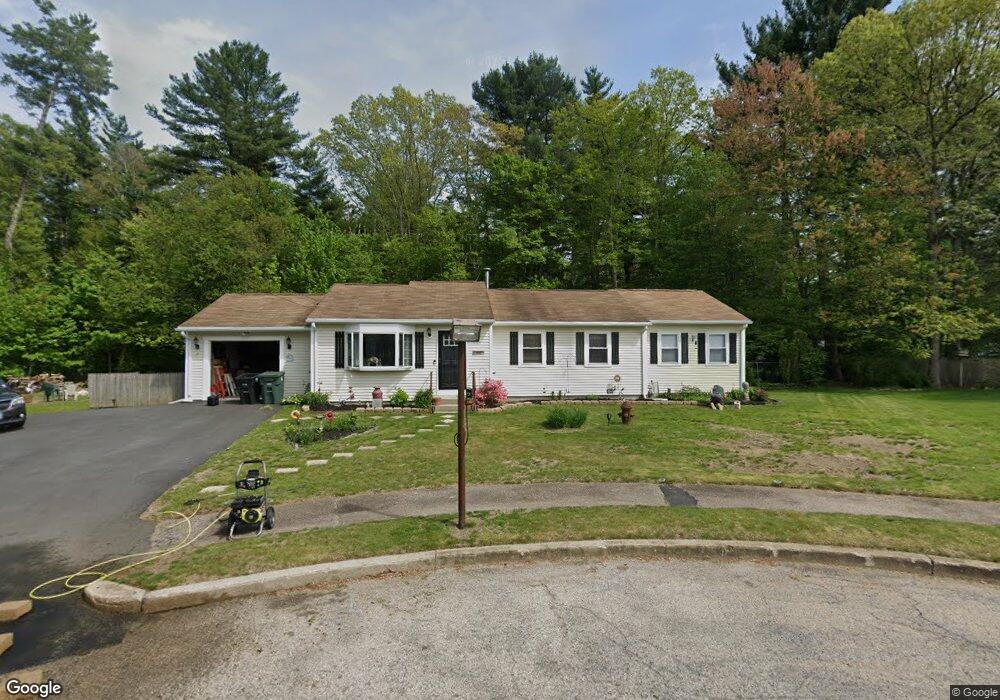
5 Mulberry Ct Coventry, RI 02816
Estimated Value: $473,000 - $578,000
3
Beds
2
Baths
1,750
Sq Ft
$299/Sq Ft
Est. Value
About This Home
This home is located at 5 Mulberry Ct, Coventry, RI 02816 and is currently estimated at $524,116, approximately $299 per square foot. 5 Mulberry Ct is a home located in Kent County with nearby schools including Alan Shawn Feinstein Ms Of Cov and Coventry High School.
Ownership History
Date
Name
Owned For
Owner Type
Purchase Details
Closed on
Oct 18, 2024
Sold by
Beckman Michael and Beckman Brandon
Bought by
Beckman Michael
Current Estimated Value
Purchase Details
Closed on
Nov 27, 1989
Sold by
Urquhart George
Bought by
Beckman James
Home Financials for this Owner
Home Financials are based on the most recent Mortgage that was taken out on this home.
Original Mortgage
$86,700
Interest Rate
9.83%
Create a Home Valuation Report for This Property
The Home Valuation Report is an in-depth analysis detailing your home's value as well as a comparison with similar homes in the area
Purchase History
We collect this data history from publicly available records. To have your information removed, we recommend requesting removal directly through your county’s website.
| Date | Buyer | Sale Price | Title Company |
|---|---|---|---|
| Beckman Michael | -- | None Available | |
| Beckman Michael | -- | None Available | |
| Beckman James | $116,000 | -- |
Source: Public Records
Mortgage History
We collect this data history from publicly available records. To have your information removed, we recommend requesting removal directly through your county’s website.
| Date | Status | Borrower | Loan Amount |
|---|---|---|---|
| Previous Owner | Beckman James | $80,200 | |
| Previous Owner | Beckman James | $86,700 |
Source: Public Records
Tax History
| Year | Tax Paid | Tax Assessment Tax Assessment Total Assessment is a certain percentage of the fair market value that is determined by local assessors to be the total taxable value of land and additions on the property. | Land | Improvement |
|---|---|---|---|---|
| 2025 | $6,346 | $394,400 | $134,600 | $259,800 |
| 2024 | $6,333 | $399,800 | $134,600 | $265,200 |
| 2023 | $6,129 | $399,800 | $134,600 | $265,200 |
| 2022 | $5,542 | $283,200 | $118,800 | $164,400 |
| 2021 | $5,494 | $283,200 | $118,800 | $164,400 |
| 2020 | $6,298 | $283,200 | $118,800 | $164,400 |
| 2019 | $5,140 | $231,100 | $82,800 | $148,300 |
| 2018 | $4,994 | $231,100 | $82,800 | $148,300 |
| 2017 | $4,848 | $231,100 | $82,800 | $148,300 |
| 2016 | $4,755 | $222,100 | $100,800 | $121,300 |
| 2015 | $4,626 | $222,100 | $100,800 | $121,300 |
| 2014 | $4,530 | $222,100 | $100,800 | $121,300 |
| 2013 | $4,583 | $245,600 | $104,900 | $140,700 |
Source: Public Records
Map
Nearby Homes
- 6 Mulberry Ct
- 3 Mulberry Ct
- 4 Mulberry Ct
- 1 Mulberry Ct
- 10 Black Walnut Dr
- 2 Mulberry Ct
- 45 Red Oak Dr
- 14 Black Walnut Dr
- 16 Black Walnut Dr
- 43 Red Oak Dr
- 12 Black Walnut Dr
- 4 Black Walnut Dr
- 18 Black Walnut Dr
- 49 Red Oak Dr
- 41 Red Oak Dr
- 7 Black Walnut Dr
- 2 Poplar Ct
- 9 Black Walnut Dr
- 20 Black Walnut Dr
- 2 Black Walnut Dr
Your Personal Tour Guide
Ask me questions while you tour the home.