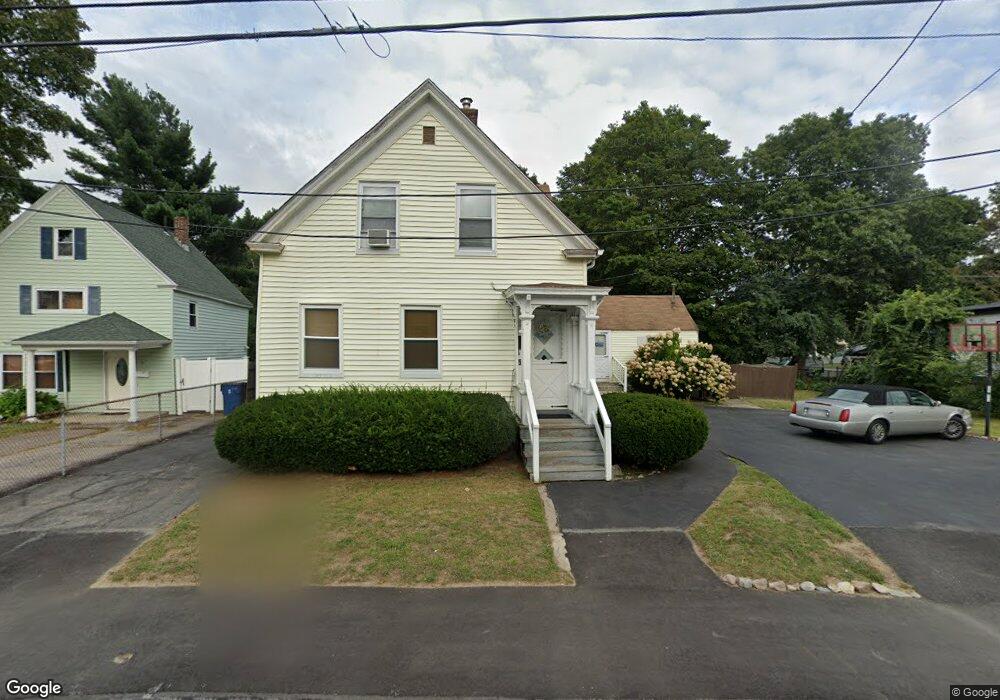
5 Orchard St Randolph, MA 02368
North Randolph NeighborhoodEstimated Value: $510,000 - $741,000
5
Beds
3
Baths
1,679
Sq Ft
$357/Sq Ft
Est. Value
About This Home
This home is located at 5 Orchard St, Randolph, MA 02368 and is currently estimated at $598,795, approximately $356 per square foot. 5 Orchard St is a home located in Norfolk County with nearby schools including Randolph High School, Boston Higashi School, and Lighthouse Baptist Christian Academy.
Ownership History
Date
Name
Owned For
Owner Type
Purchase Details
Closed on
Jun 7, 2002
Sold by
Marusich Rt
Bought by
Baker Michael P and Baker Kimberly M
Current Estimated Value
Home Financials for this Owner
Home Financials are based on the most recent Mortgage that was taken out on this home.
Original Mortgage
$259,620
Outstanding Balance
$110,471
Interest Rate
6.9%
Mortgage Type
Purchase Money Mortgage
Estimated Equity
$488,324
Create a Home Valuation Report for This Property
The Home Valuation Report is an in-depth analysis detailing your home's value as well as a comparison with similar homes in the area
Home Values in the Area
Average Home Value in this Area
Purchase History
| Date | Buyer | Sale Price | Title Company |
|---|---|---|---|
| Baker Michael P | $265,000 | -- |
Source: Public Records
Mortgage History
| Date | Status | Borrower | Loan Amount |
|---|---|---|---|
| Open | Baker Michael P | $259,620 |
Source: Public Records
Tax History
| Year | Tax Paid | Tax Assessment Tax Assessment Total Assessment is a certain percentage of the fair market value that is determined by local assessors to be the total taxable value of land and additions on the property. | Land | Improvement |
|---|---|---|---|---|
| 2025 | $6,388 | $550,200 | $236,800 | $313,400 |
| 2024 | $5,929 | $517,800 | $232,300 | $285,500 |
| 2023 | $5,542 | $458,800 | $211,200 | $247,600 |
| 2022 | $5,277 | $388,000 | $175,900 | $212,100 |
| 2021 | $5,472 | $370,200 | $146,700 | $223,500 |
| 2020 | $5,256 | $352,500 | $146,700 | $205,800 |
| 2019 | $4,967 | $331,600 | $139,700 | $191,900 |
| 2018 | $4,600 | $289,700 | $126,900 | $162,800 |
| 2017 | $4,508 | $278,600 | $120,900 | $157,700 |
| 2016 | $4,194 | $241,200 | $110,100 | $131,100 |
| 2015 | $3,998 | $220,900 | $104,900 | $116,000 |
Source: Public Records
Map
Nearby Homes
- 19 Clark St
- 22 Clark St
- 33 Clark St Unit A
- 12 Jasper Ln Unit 12
- 20 Jasper Ln
- 71 Pond Ln
- 37 Himoor Cir
- 35 Pearl St Unit 35
- 11 Mcauliffe Rd
- 1 Royal Crest Dr Unit 3
- 12 Brewster Rd
- 14 Lewis Rd
- 64 North St
- 159 Bittersweet Ln Unit 103
- 42 Maitland Ave
- 107 Meadow Ln Unit 107
- 25 Gloversbrook Rd
- 232 Canton St Unit 308
- 232 Canton St Unit 112
- 232 Canton St Unit 104
Your Personal Tour Guide
Ask me questions while you tour the home.