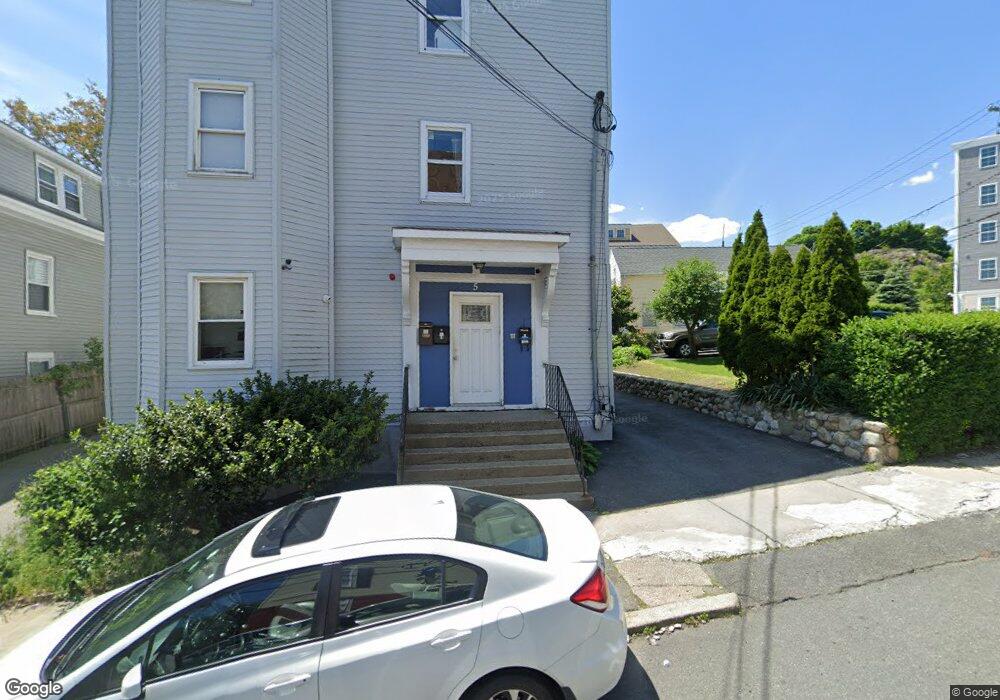
5 Oxford St Lynn, MA 01902
Downtown Lynn NeighborhoodEstimated Value: $853,176 - $1,086,000
About This Home
This home is located at 5 Oxford St, Lynn, MA 01902 and is currently estimated at $979,044, approximately $221 per square foot. 5 Oxford St is a home located in Essex County with nearby schools including E.J. Harrington School, William R. Fallon School, and Fecteau-Leary Junior/Senior High School.
Ownership History
We collect this data history from publicly available records. To have your information removed, we recommend requesting removal directly through your county’s website.
Purchase Details
Home Financials for this Owner
Home Financials are based on the most recent Mortgage that was taken out on this home.Home Values in the Area
Average Home Value in this Area
Purchase History
We collect this data history from publicly available records. To have your information removed, we recommend requesting removal directly through your county’s website.
| Date | Buyer | Sale Price | Title Company |
|---|---|---|---|
| $446,000 | -- |
Mortgage History
We collect this data history from publicly available records. To have your information removed, we recommend requesting removal directly through your county’s website.
| Date | Status | Borrower | Loan Amount |
|---|---|---|---|
| Open | $446,000 | ||
| Previous Owner | $96,200 | ||
| Previous Owner | $91,000 | ||
| Previous Owner | $80,000 |
Tax History
We collect this data history from publicly available records. To have your information removed, we recommend requesting removal directly through your county’s website.
| Year | Tax Paid | Tax Assessment Tax Assessment Total Assessment is a certain percentage of the fair market value that is determined by local assessors to be the total taxable value of land and additions on the property. | Land | Improvement |
|---|---|---|---|---|
| 2025 | $9,395 | $906,900 | $203,100 | $703,800 |
| 2024 | $9,392 | $891,900 | $195,900 | $696,000 |
| 2023 | $8,648 | $775,600 | $154,400 | $621,200 |
| 2022 | $8,638 | $694,900 | $139,500 | $555,400 |
| 2021 | $8,200 | $629,300 | $123,700 | $505,600 |
| 2020 | $7,787 | $581,100 | $116,400 | $464,700 |
| 2019 | $7,420 | $518,900 | $98,400 | $420,500 |
| 2018 | $6,880 | $454,100 | $97,500 | $356,600 |
| 2017 | $6,613 | $423,900 | $85,800 | $338,100 |
| 2016 | $5,919 | $365,800 | $64,500 | $301,300 |
| 2015 | $5,328 | $318,100 | $61,400 | $256,700 |
Map
- 10 Essex Ct
- 16 Mount Hood Terrace Unit 7
- 54 Central Square Unit 4A
- 7 Central Square Unit 306
- 7 Central Square Unit 307
- 7 Central Square Unit 203
- 7 Central Square Unit 401
- 38 High Rock St
- 48 High Rock St Unit 1
- 170 Oxford St Unit 504
- 43 High Rock St
- 51 High Rock St
- 49 Munroe St Unit 406
- 17 Acorn St
- 6 Rockaway Ct
- 111 Adams St
- 87 Broad St Unit 3
- 343 Essex St
- 9 Hamilton Ave
- 28-30 Hollingsworth St
- 9 Oxford St
- 9 Oxford St Unit 2
- 9 Oxford St
- 9 Oxford St Unit 3
- 57 Oxford Terrace
- 13 Oxford St
- 42 High St
- 85 Buffum St
- 85 Buffum St Unit 2
- 999 High St Unit 2
- 999 High St Unit 3
- 2277 High St Unit 3
- 95 Buffum St
- 472 Essex St Unit 101
- 472 Essex St Unit 102
- 472 Essex St Unit 504
- 472 Essex St Unit 502
- 472 Essex St Unit 403
- 472 Essex St Unit 402
- 472 Essex St Unit 405
Ask me questions while you tour the home.