5 Pine Dr Unit 3 Spring Lake, NJ 07762
Estimated Value: $800,584 - $903,000
2
Beds
3
Baths
1,172
Sq Ft
$731/Sq Ft
Est. Value
About This Home
This home is located at 5 Pine Dr Unit 3, Spring Lake, NJ 07762 and is currently estimated at $857,146, approximately $731 per square foot. 5 Pine Dr Unit 3 is a home located in Monmouth County with nearby schools including Spring Lake Heights Elementary School, St. Catharine School, and The Brookside School.
Ownership History
Date
Name
Owned For
Owner Type
Purchase Details
Closed on
Aug 19, 2008
Sold by
Deamicis Louis M and Deamicis Elizabeth L
Bought by
Deamicis Elizabeth L
Current Estimated Value
Purchase Details
Closed on
Jul 9, 2007
Sold by
Clayton Jeffrey A and Clayton Virginia A
Bought by
Deamicis Louis M and Deamicis Elizabeth L
Purchase Details
Closed on
Jun 14, 2005
Sold by
Mccorry Daniel
Bought by
Clayton Jeffrey A and Clayton Virginia M
Home Financials for this Owner
Home Financials are based on the most recent Mortgage that was taken out on this home.
Original Mortgage
$100,000
Interest Rate
5.82%
Mortgage Type
New Conventional
Create a Home Valuation Report for This Property
The Home Valuation Report is an in-depth analysis detailing your home's value as well as a comparison with similar homes in the area
Home Values in the Area
Average Home Value in this Area
Purchase History
We collect this data history from publicly available records. To have your information removed, we recommend requesting removal directly through your county’s website.
| Date | Buyer | Sale Price | Title Company |
|---|---|---|---|
| Deamicis Elizabeth L | -- | None Available | |
| Deamicis Louis M | $437,500 | Fidelity National Title Ins | |
| Clayton Jeffrey A | $379,000 | -- |
Source: Public Records
Mortgage History
We collect this data history from publicly available records. To have your information removed, we recommend requesting removal directly through your county’s website.
| Date | Status | Borrower | Loan Amount |
|---|---|---|---|
| Previous Owner | Clayton Jeffrey A | $100,000 |
Source: Public Records
Tax History
| Year | Tax Paid | Tax Assessment Tax Assessment Total Assessment is a certain percentage of the fair market value that is determined by local assessors to be the total taxable value of land and additions on the property. | Land | Improvement |
|---|---|---|---|---|
| 2025 | $7,204 | $738,000 | $526,200 | $211,800 |
| 2024 | $6,755 | $684,100 | $476,200 | $207,900 |
| 2023 | $6,755 | $603,100 | $400,000 | $203,100 |
| 2022 | $6,290 | $499,500 | $350,000 | $149,500 |
| 2021 | $6,290 | $465,900 | $330,000 | $135,900 |
| 2020 | $5,750 | $423,400 | $300,000 | $123,400 |
| 2019 | $5,761 | $419,900 | $300,000 | $119,900 |
| 2018 | $5,792 | $410,800 | $300,000 | $110,800 |
| 2017 | $5,568 | $409,400 | $300,000 | $109,400 |
| 2016 | $5,618 | $408,000 | $300,000 | $108,000 |
| 2015 | $4,740 | $345,200 | $240,000 | $105,200 |
| 2014 | $4,739 | $352,900 | $240,000 | $112,900 |
Source: Public Records
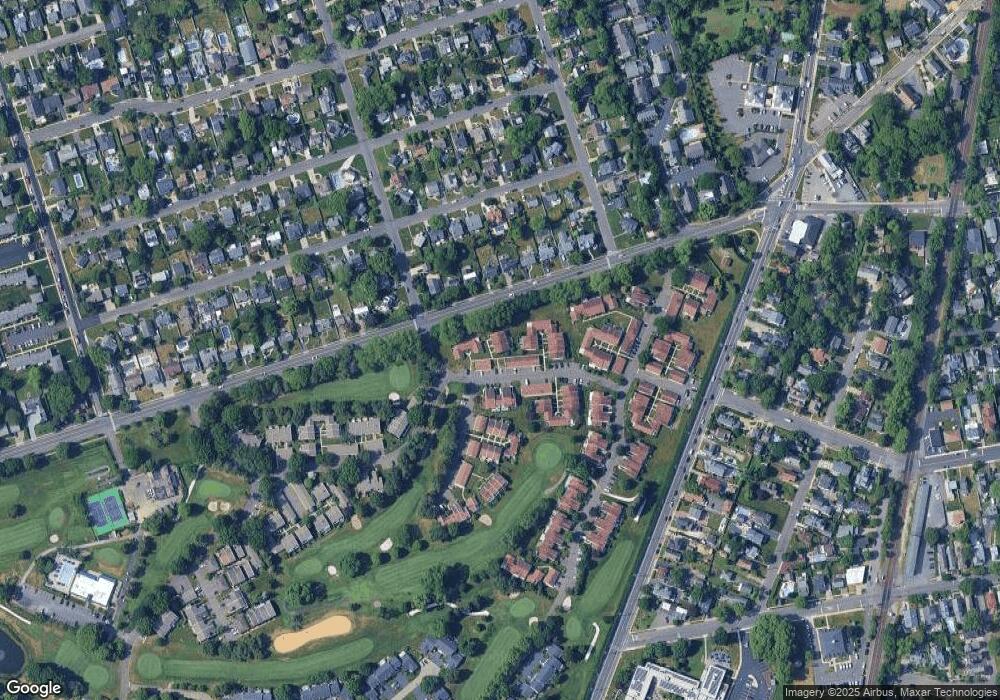
Map
Nearby Homes
- 905 Woodcrest Dr
- 907 Woodcrest Dr
- 1705 Beverly Ave
- 9 Dogwood Ct
- 3 Ashford Ct
- 3 Willow Ln
- 2121 4th Ave
- 513 Mercer Ave
- 89 Maple Dr Unit 6
- 604 State Route 71
- 327 South Blvd
- 600 State Route 71 Unit 9
- 604 Monmouth Ave
- 15 Old Mill Ct
- 1909 Cottage Place
- 202 Ludlow Ave
- 217 Pitney Ave
- 502 Monmouth Ave
- 117 Madison Ave
- 118 Warren Ave
Your Personal Tour Guide
Ask me questions while you tour the home.