T
Seller's Agent in 2014
Tom Nolan
Keller Williams Revolution
(217) 521-2603
1 in this area
8 Total Sales

Estimated Value: $188,000 - $226,377
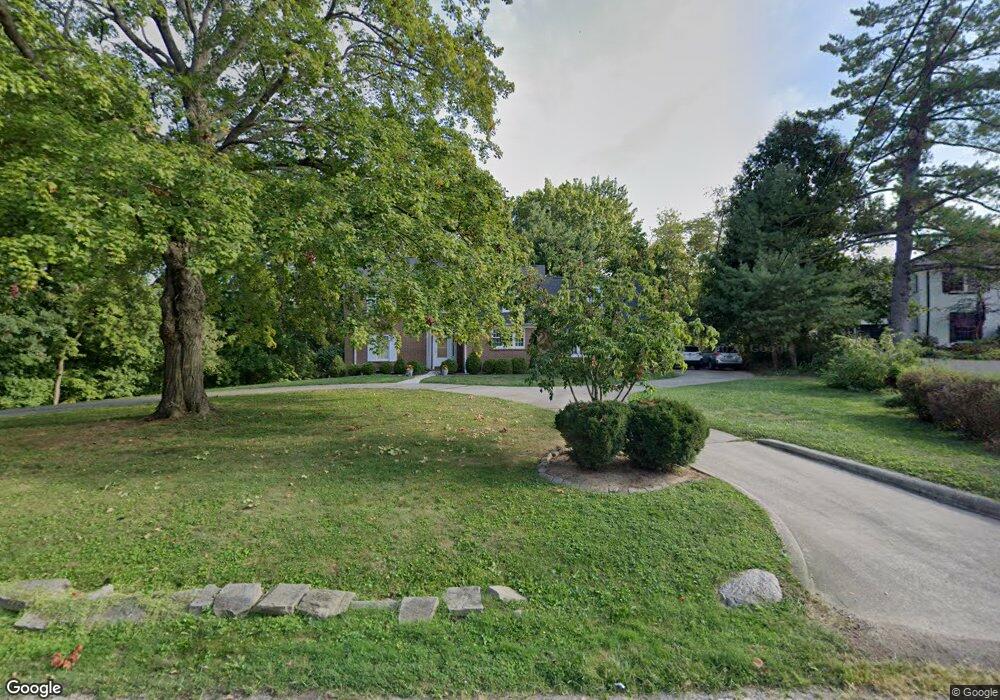
Charming home in impeccable condition. Gracious setting to enjoy the view of wildlife in an adjacent 3/4 acre wood forest that offer privacy and beauty. Large screened porch off dining room with covered deck above off master bedroom. Large living room with fireplace, lots of storage areas. Full basement with fireplace and half bath. This purchase includes parcel # 04-12-15-454-004.
We collect this data history from publicly available records. To have your information removed, we recommend requesting removal directly through your county’s website.
| Date | Buyer | Sale Price | Title Company |
|---|---|---|---|
| Rockafellow Erin Marie | -- | None Available | |
| Rogness Donald C | $195,000 | None Available | |
| Jordan Jeffrey A | -- | None Available | |
| Jordon Jeffrey A | $190,000 | None Available |
We collect this data history from publicly available records. To have your information removed, we recommend requesting removal directly through your county’s website.
| Date | Status | Borrower | Loan Amount |
|---|---|---|---|
| Previous Owner | Rogness Donald C | $185,200 | |
| Previous Owner | Jordan Jeffrey A | $172,000 | |
| Previous Owner | Jordon Jeffrey A | $151,925 |
| Date | Event | Price | List to Sale | Price per Sq Ft |
|---|---|---|---|---|
| 05/30/2014 05/30/14 | Sold | $195,000 | -6.0% | $76 / Sq Ft |
| 04/30/2014 04/30/14 | Pending | -- | -- | -- |
| 07/01/2013 07/01/13 | For Sale | $207,500 | -- | $80 / Sq Ft |
| Year | Tax Paid | Tax Assessment Tax Assessment Total Assessment is a certain percentage of the fair market value that is determined by local assessors to be the total taxable value of land and additions on the property. | Land | Improvement |
|---|---|---|---|---|
| 2024 | $5,758 | $65,477 | $17,116 | $48,361 |
| 2023 | $5,689 | $63,159 | $16,510 | $46,649 |
| 2022 | $5,364 | $58,445 | $15,278 | $43,167 |
| 2021 | $4,999 | $54,581 | $14,268 | $40,313 |
| 2020 | $4,897 | $52,048 | $13,606 | $38,442 |
| 2019 | $4,897 | $52,048 | $13,606 | $38,442 |
| 2018 | $4,899 | $52,629 | $11,598 | $41,031 |
| 2017 | $5,031 | $54,034 | $11,908 | $42,126 |
| 2016 | $5,134 | $54,586 | $12,030 | $42,556 |
| 2015 | $4,868 | $53,621 | $11,817 | $41,804 |
| 2014 | $4,514 | $53,090 | $11,700 | $41,390 |
| 2013 | $4,686 | $55,084 | $12,139 | $42,945 |
T
Seller's Agent in 2014
Tom Nolan
Keller Williams Revolution
(217) 521-2603
1 in this area
8 Total Sales
Source: Central Illinois Board of REALTORS®
MLS Number: 5191614
APN: 04-12-15-454-003
Ask me questions while you tour the home.
