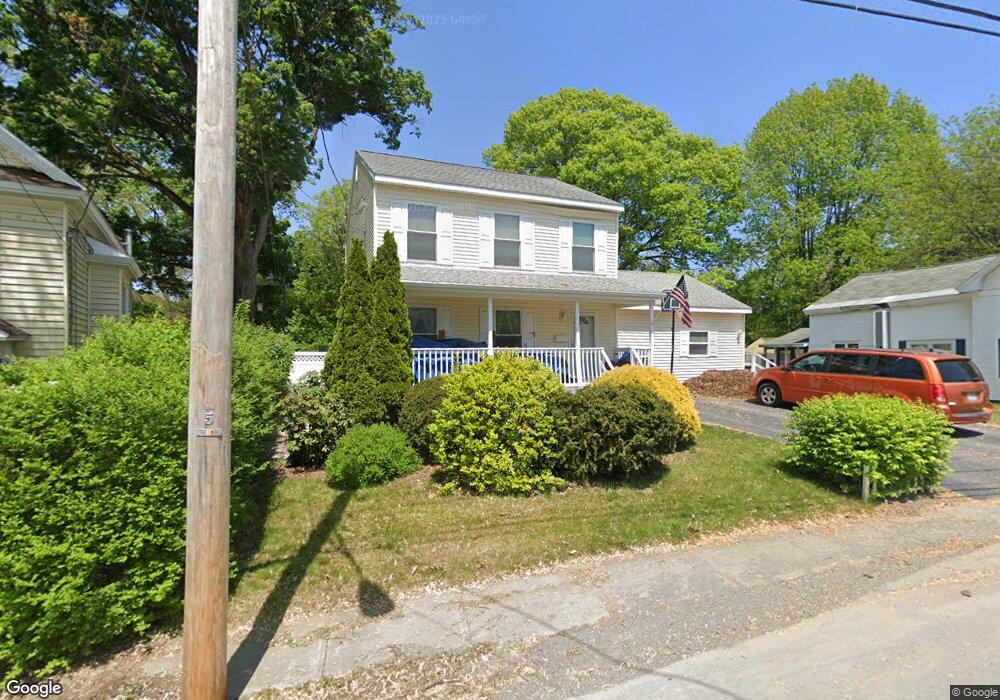
5 Spring St Hudson Falls, NY 12839
Estimated Value: $281,000 - $357,000
3
Beds
2
Baths
1,776
Sq Ft
$178/Sq Ft
Est. Value
About This Home
This home is located at 5 Spring St, Hudson Falls, NY 12839 and is currently estimated at $315,735, approximately $177 per square foot. 5 Spring St is a home located in Washington County with nearby schools including Margaret Murphy Kindergarten Center, Hudson Falls Intermediate School, and Hudson Falls Primary School.
Ownership History
Date
Name
Owned For
Owner Type
Purchase Details
Closed on
Oct 26, 2005
Sold by
Hei Development Corp
Bought by
Rockefeller Cynthia
Current Estimated Value
Home Financials for this Owner
Home Financials are based on the most recent Mortgage that was taken out on this home.
Original Mortgage
$121,250
Outstanding Balance
$20,597
Interest Rate
5.85%
Mortgage Type
Purchase Money Mortgage
Estimated Equity
$295,138
Purchase Details
Closed on
Jun 22, 2005
Sold by
Gaal Gabriel
Bought by
Leonbruno Peter
Create a Home Valuation Report for This Property
The Home Valuation Report is an in-depth analysis detailing your home's value as well as a comparison with similar homes in the area
Home Values in the Area
Average Home Value in this Area
Purchase History
| Date | Buyer | Sale Price | Title Company |
|---|---|---|---|
| Rockefeller Cynthia | $127,726 | Bruce Carr | |
| Hei Development Corp | $20,000 | William Nikas | |
| Leonbruno Peter | $15,000 | William Nikas |
Source: Public Records
Mortgage History
| Date | Status | Borrower | Loan Amount |
|---|---|---|---|
| Open | Hei Development Corp | $121,250 | |
| Closed | Hei Development Corp | $121,250 |
Source: Public Records
Tax History
| Year | Tax Paid | Tax Assessment Tax Assessment Total Assessment is a certain percentage of the fair market value that is determined by local assessors to be the total taxable value of land and additions on the property. | Land | Improvement |
|---|---|---|---|---|
| 2024 | $6,913 | $272,700 | $27,500 | $245,200 |
| 2023 | $6,399 | $239,200 | $27,500 | $211,700 |
| 2022 | $5,419 | $194,000 | $27,500 | $166,500 |
| 2021 | $5,346 | $185,000 | $27,500 | $157,500 |
| 2020 | $4,705 | $170,700 | $27,500 | $143,200 |
| 2019 | $4,694 | $170,700 | $27,500 | $143,200 |
| 2018 | $4,694 | $170,000 | $27,500 | $142,500 |
| 2017 | $4,587 | $165,000 | $27,500 | $137,500 |
| 2016 | $4,688 | $165,000 | $27,500 | $137,500 |
| 2015 | -- | $176,600 | $27,500 | $149,100 |
| 2014 | -- | $174,900 | $27,500 | $147,400 |
Source: Public Records
Map
Nearby Homes
Your Personal Tour Guide
Ask me questions while you tour the home.