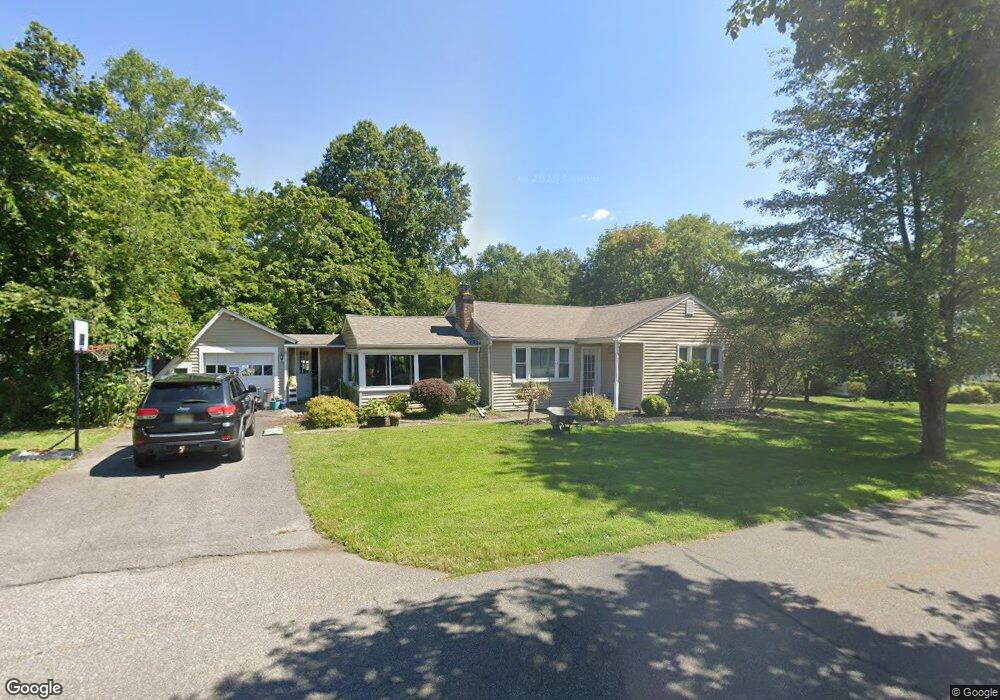
5 W Main St High Bridge, NJ 08829
Estimated Value: $387,000 - $486,000
Studio
--
Bath
1,416
Sq Ft
$313/Sq Ft
Est. Value
About This Home
This home is located at 5 W Main St, High Bridge, NJ 08829 and is currently estimated at $443,850, approximately $313 per square foot. 5 W Main St is a home located in Hunterdon County with nearby schools including High Bridge Elementary School, High Bridge Middle School, and Voorhees High School.
Ownership History
Date
Name
Owned For
Owner Type
Purchase Details
Closed on
Sep 25, 2017
Sold by
Hughes Lynn and Exley Donna
Bought by
Exley Brian M
Current Estimated Value
Home Financials for this Owner
Home Financials are based on the most recent Mortgage that was taken out on this home.
Original Mortgage
$129,222
Outstanding Balance
$109,158
Interest Rate
4.25%
Mortgage Type
FHA
Estimated Equity
$334,692
Purchase Details
Closed on
Oct 17, 2016
Sold by
Hughes Lynn and Exley Donna
Bought by
Hughes Lynn and Exley Donna
Create a Home Valuation Report for This Property
The Home Valuation Report is an in-depth analysis detailing your home's value as well as a comparison with similar homes in the area
Home Values in the Area
Average Home Value in this Area
Purchase History
| Date | Buyer | Sale Price | Title Company |
|---|---|---|---|
| Exley Brian M | $159,000 | Monarch Title Agency Inc | |
| Hughes Lynn | -- | None Available |
Source: Public Records
Mortgage History
| Date | Status | Borrower | Loan Amount |
|---|---|---|---|
| Open | Exley Brian M | $129,222 |
Source: Public Records
Tax History
| Year | Tax Paid | Tax Assessment Tax Assessment Total Assessment is a certain percentage of the fair market value that is determined by local assessors to be the total taxable value of land and additions on the property. | Land | Improvement |
|---|---|---|---|---|
| 2025 | $9,054 | $293,200 | $148,500 | $144,700 |
| 2024 | $8,442 | $277,400 | $126,800 | $150,600 |
Source: Public Records
Map
Nearby Homes
Your Personal Tour Guide
Ask me questions while you tour the home.