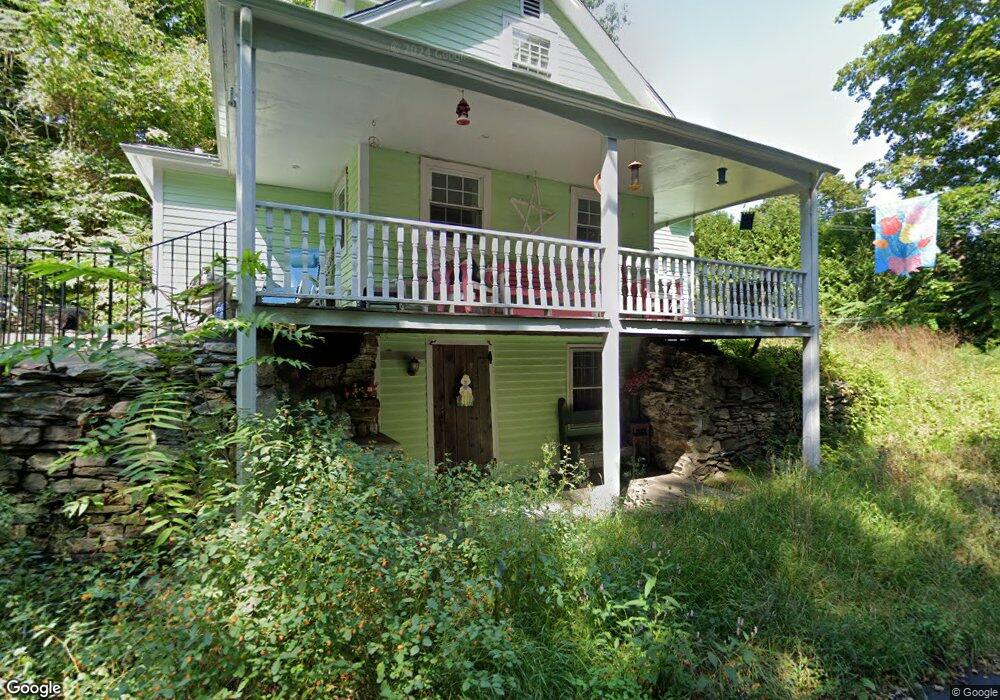
50 Maple St Chester, CT 06412
Estimated Value: $381,027 - $444,000
2
Beds
2
Baths
1,040
Sq Ft
$396/Sq Ft
Est. Value
About This Home
This home is located at 50 Maple St, Chester, CT 06412 and is currently estimated at $412,007, approximately $396 per square foot. 50 Maple St is a home located in Middlesex County with nearby schools including Valley Regional High School.
Ownership History
Date
Name
Owned For
Owner Type
Purchase Details
Closed on
Oct 3, 2011
Sold by
Scavetta Vaughn and Scavetta Christine L
Bought by
Cieri Catherine E
Current Estimated Value
Home Financials for this Owner
Home Financials are based on the most recent Mortgage that was taken out on this home.
Original Mortgage
$161,850
Outstanding Balance
$110,654
Interest Rate
4.15%
Estimated Equity
$301,353
Purchase Details
Closed on
Oct 31, 2001
Sold by
Camilieri Scott J
Bought by
Scavette Vaughn and Scavette Christine L
Purchase Details
Closed on
Jun 2, 1989
Sold by
Everett Rory A
Bought by
Camileri Scott J
Create a Home Valuation Report for This Property
The Home Valuation Report is an in-depth analysis detailing your home's value as well as a comparison with similar homes in the area
Home Values in the Area
Average Home Value in this Area
Purchase History
| Date | Buyer | Sale Price | Title Company |
|---|---|---|---|
| Cieri Catherine E | $231,250 | -- | |
| Cieri Catherine E | $231,250 | -- | |
| Scavette Vaughn | $197,000 | -- | |
| Scavette Vaughn | $197,000 | -- | |
| Camileri Scott J | $110,000 | -- |
Source: Public Records
Mortgage History
| Date | Status | Borrower | Loan Amount |
|---|---|---|---|
| Open | Camileri Scott J | $161,850 | |
| Closed | Camileri Scott J | $161,850 | |
| Previous Owner | Camileri Scott J | $191,735 |
Source: Public Records
Tax History
| Year | Tax Paid | Tax Assessment Tax Assessment Total Assessment is a certain percentage of the fair market value that is determined by local assessors to be the total taxable value of land and additions on the property. | Land | Improvement |
|---|---|---|---|---|
| 2025 | $4,724 | $174,440 | $65,800 | $108,640 |
| 2024 | $4,265 | $174,440 | $65,800 | $108,640 |
| 2023 | $4,375 | $147,300 | $67,920 | $79,380 |
| 2022 | $4,345 | $147,300 | $67,920 | $79,380 |
| 2021 | $4,345 | $147,300 | $67,920 | $79,380 |
| 2020 | $4,216 | $147,300 | $67,920 | $79,380 |
| 2019 | $4,241 | $147,300 | $67,920 | $79,380 |
| 2018 | $4,097 | $151,130 | $71,690 | $79,440 |
| 2017 | $3,984 | $151,130 | $71,690 | $79,440 |
| 2016 | $3,047 | $151,130 | $71,690 | $79,440 |
| 2015 | $3,827 | $151,130 | $71,690 | $79,440 |
| 2014 | $3,751 | $151,130 | $71,690 | $79,440 |
Source: Public Records
Map
Nearby Homes
- 6 Pelton Hill Rd
- 43 Bokum Rd
- 79 Middlesex Ave
- 11 Winter Ave
- 33 Castle Heights
- 92 Main St Unit 202
- 92 Main St Unit 417
- 92 Main St Unit 206
- 92 Main St Unit 101
- 87 Main St
- 8 Prospect Hill
- 113 Union St Unit Z
- 11 Kings Hwy
- 1 Ferry Rd
- 170 Main St
- 62 River St
- 209 Main St
- 257 W Elm St
- 26 Ferry Rd
- 59 Wig Hill Rd
Your Personal Tour Guide
Ask me questions while you tour the home.