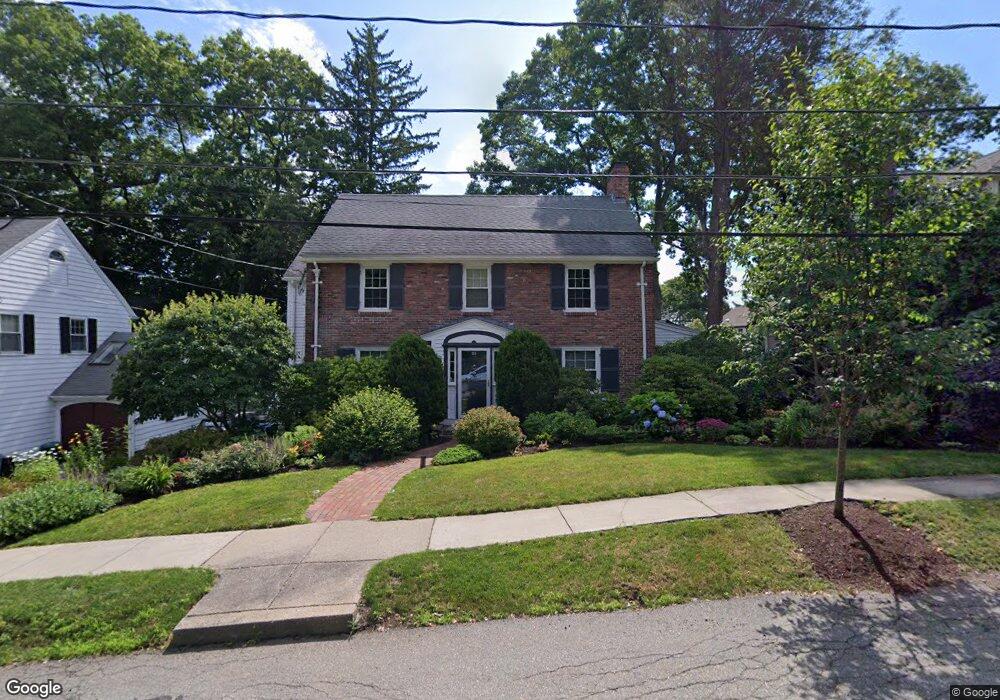
50 Solon St Newton Highlands, MA 02461
Newton Highlands NeighborhoodEstimated Value: $1,518,059
About This Home
This home is located at 50 Solon St, Newton Highlands, MA 02461 and is currently estimated at $1,518,059, approximately $745 per square foot. 50 Solon St is a home located in Middlesex County with nearby schools including Countryside Elementary School, Charles E Brown Middle School, and Newton South High School.
Ownership History
We collect this data history from publicly available records. To have your information removed, we recommend requesting removal directly through your county’s website.
Purchase Details
Purchase Details
Home Financials for this Owner
Home Financials are based on the most recent Mortgage that was taken out on this home.Home Values in the Area
Average Home Value in this Area
Purchase History
We collect this data history from publicly available records. To have your information removed, we recommend requesting removal directly through your county’s website.
| Date | Buyer | Sale Price | Title Company |
|---|---|---|---|
| -- | None Available | ||
| $362,000 | -- |
Mortgage History
We collect this data history from publicly available records. To have your information removed, we recommend requesting removal directly through your county’s website.
| Date | Status | Borrower | Loan Amount |
|---|---|---|---|
| Previous Owner | $175,000 | ||
| Previous Owner | $175,000 | ||
| Previous Owner | $280,000 |
Tax History
We collect this data history from publicly available records. To have your information removed, we recommend requesting removal directly through your county’s website.
| Year | Tax Paid | Tax Assessment Tax Assessment Total Assessment is a certain percentage of the fair market value that is determined by local assessors to be the total taxable value of land and additions on the property. | Land | Improvement |
|---|---|---|---|---|
| 2025 | -- | $1,198,300 | $870,700 | $327,600 |
| 2024 | -- | $1,163,400 | $845,300 | $318,100 |
| 2023 | $0 | $1,059,600 | $641,000 | $418,600 |
| 2022 | $0 | $979,500 | $593,500 | $386,000 |
| 2021 | $0 | $924,100 | $559,900 | $364,200 |
| 2020 | $10,531 | $924,100 | $559,900 | $364,200 |
| 2019 | $0 | $897,200 | $543,600 | $353,600 |
| 2018 | $9,936 | $833,700 | $493,600 | $340,100 |
| 2017 | $7,859 | $786,500 | $465,700 | $320,800 |
| 2016 | $7,859 | $728,300 | $435,200 | $293,100 |
| 2015 | $7,859 | $676,900 | $406,700 | $270,200 |
Map
- 125 Oakdale Rd
- 102 Oakdale Rd
- 89 Parker Ave
- 71 Cloverdale Rd
- 71 Cloverdale Rd Unit 1
- 52 Rockledge Rd
- 60 Cloverdale Rd Unit 62
- 669 Boylston St
- 19 Selwyn Rd
- 130 Winchester St
- 2 Cannon St
- 6 Truman Rd
- 1151 Walnut St Unit 402
- 1151 Walnut St Unit 203
- 1151 Walnut St Unit 210
- 1151 Walnut St Unit 406
- 1151 Walnut St Unit 201
- 1151 Walnut St Unit 302
- 44 Rowena Rd
- 5 Sheldon Rd
Ask me questions while you tour the home.